
Saint-Gobain: a weak week, rejected again at resistance
Saint-Gobain drops 5.5% and slides back toward support in the 75 area
Saint-Gobain: a weak week, rejected again at resistance
Our view last week
Saint-Gobain is at week 11 of a buy signal, with the model's time window now closed and none of the 3 price references reached: the trade sits just below breakeven. Signal strength has slipped to 44 out of 100, and the weekly structure remains stuck in the middle. It ranks 46th among the 62 buy signals already running on European-UK stocks.
This week's summary
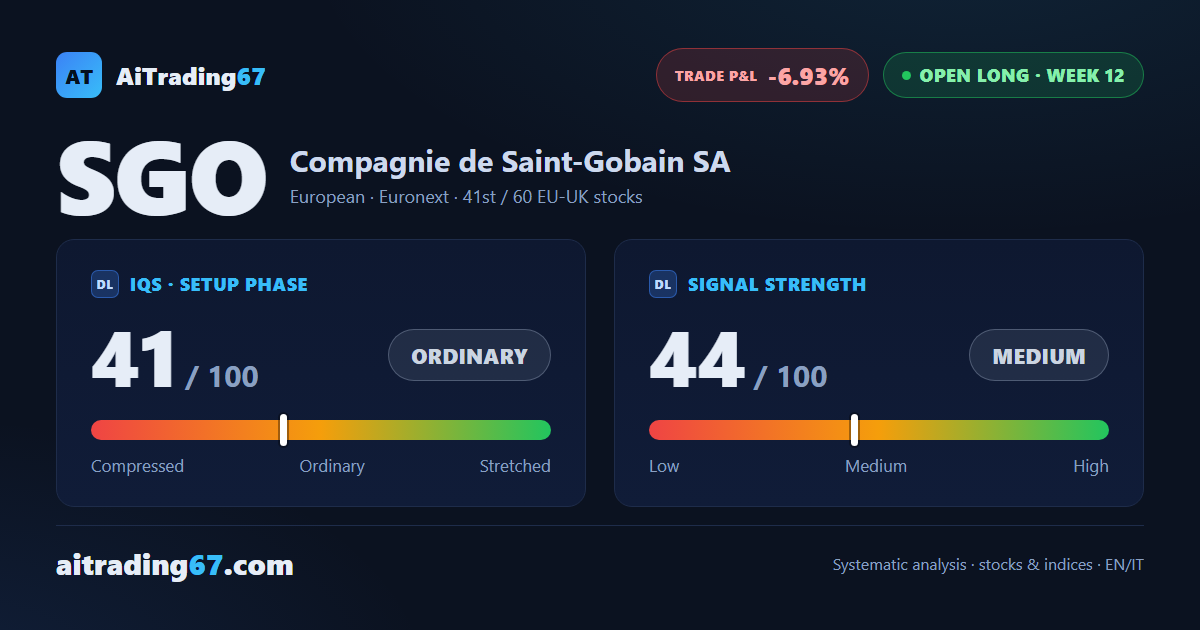
Saint-Gobain closed the week down 5.5%: the stock is back near support in the 75 area, after repeated rejections at resistance between 77 and 78. The ADX has been sliding for three weeks, buyer dominance is collapsing, and sellers ruled the last session — the technical picture is losing conviction. This price action trading read looks at where the next move could take it.
IQS Phase
41
ordinary
Signal Strength
44
medium · weak
Sizing
REDUCED
Ranking
#41 / 60
EU-UK stocks in progress
Trade P&L %
-6.93%
from signal to today
restricted Platinum content