Shell declining — week 9
Shell weakens at week 9: decline accelerates after June's false recovery
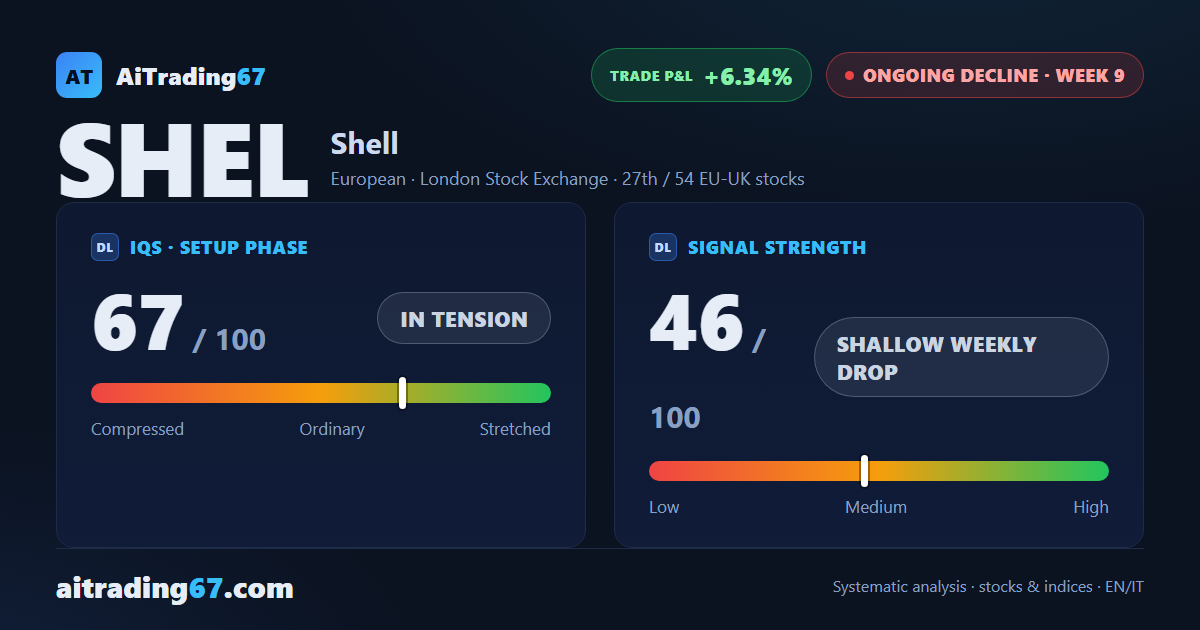
Shell declining — week 9
In Summary
Shell enters week 9 of its sell signal: after a three-week pause — including a 3.5% bounce in early June — the decline resumed with conviction. The week closed at −7%, sell volume at 73%, and distribution indicators accelerating. Opening at elevated risk per our model; for those already positioned, this is the clearest technical picture of the past month.
IQS Phase
67
in tension
Signal Strength
46
shallow weekly drop
Sizing
REDUCED
Ranking
#27 / 54
EU-UK stocks
Trade P&L %
+6.34%
from signal to today
restricted Platinum content