
Siemens Healthineers: sell signal, week 11
Siemens Healthineers slips 1.1%, boxed between two moving averages
Siemens Healthineers: sell signal, week 11
Our view last week
Week 10 for the sell signal on Siemens Healthineers: the week just closed recovered 2.2%, with buy volume climbing to 95%. Price is working just below a double bottom in the 33 area, with an intermediate 6% rebound already banked. Here is how the trade in management is evolving technically.
This week's summary
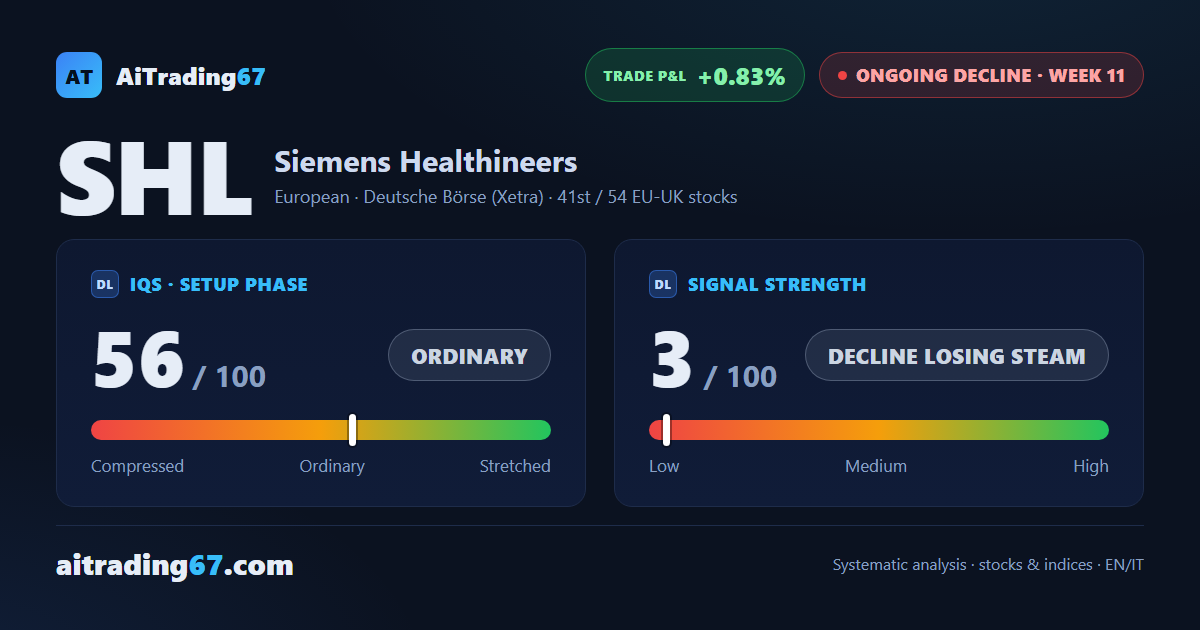
Siemens Healthineers is working in a very tight corridor, between the daily Kumo floor in the 34.6 area and a cluster of moving averages just below, in the 34.55 area: after last week's rebound, price gave back 1.1% this week and sellers took back control, 65% of the trade. The double bottom in the 33 area still holds. Technical analysis: the sell signal has been under management for 11 weeks, with the gain nearly wiped to zero, under 1%.
IQS Phase
56
ordinary
Signal Strength
3
decline losing steam
Sizing
MINIMUM
Ranking
#41 / 54
EU-UK stocks
Trade P&L %
+0.83%
from signal to today
restricted Platinum content