
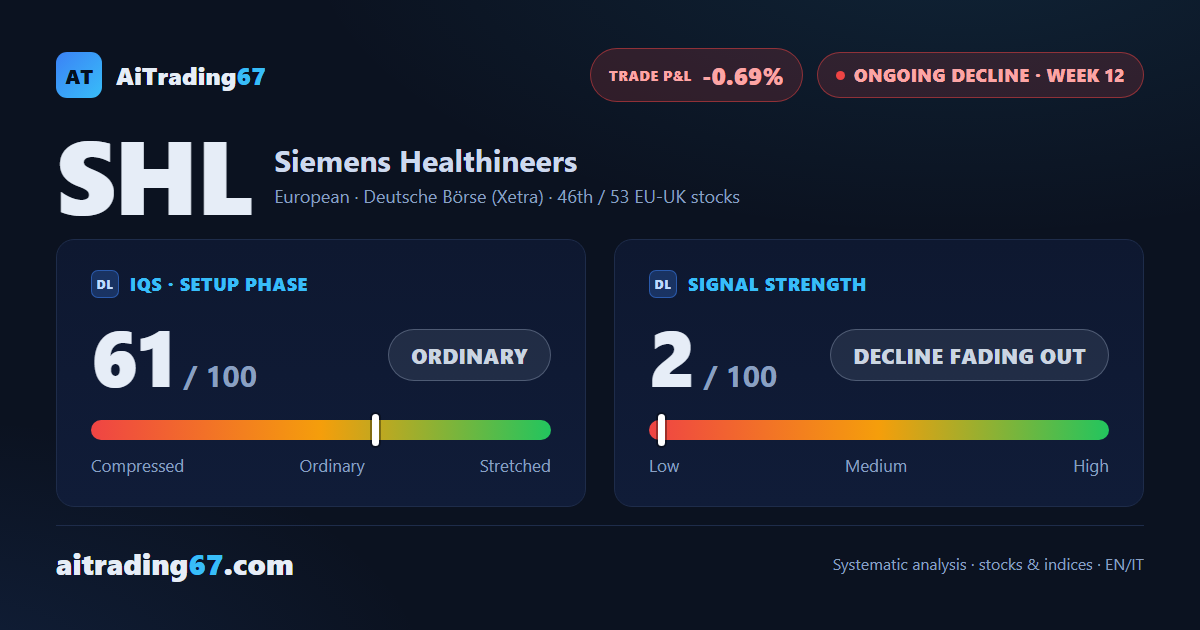
The sell signal loses steam, first signs of fatigue
Siemens Healthineers rebounds 1.5% as the sell signal shows signs of fatigue
The sell signal loses steam, first signs of fatigue
Our view last week
Siemens Healthineers is working in a very tight corridor, between the daily Kumo floor in the 34.6 area and a cluster of moving averages just below, in the 34.55 area: after last week's rebound, price gave back 1.1% this week and sellers took back control, 65% of the trade. The double bottom in the 33 area still holds. Technical analysis: the sell signal has been under management for 11 weeks, with the gain nearly wiped to zero, under 1%.
This week's summary
Siemens Healthineers shares catch a breath: in this week's technical analysis, the stock recovers 1.5%, with buyers back in control at 66% of the trade and money flow flipping positive. Price, though, stays boxed in a very tight corridor just above the 35 area, and the period's double bottom still holds. The sell signal, running for 12 weeks now, is drifting close to breakeven.
IQS Phase
61
ordinary
Signal Strength
2
decline fading out
Sizing
MINIMUM
Ranking
#46 / 53
EU-UK stocks
Trade P&L %
-0.69%
from signal to today
restricted Platinum content