
Siemens: the trade holds, but the pace slows
Siemens slips 4% and stalls in a tight range, though the structure stays bullish
Siemens: the trade holds, but the pace slows
Our view last week
Siemens is in week 11 of an open buy signal, up 14.72% since entry. The weekly structure remains bullish, with all four structural moving averages aligned, but the price is hugging its all-time highs, leaving little room before the next resistance. All 3 targets of our most advanced model have already been hit, and the stop now trails the Inversion Point, in the 259.6 area.
This week's summary
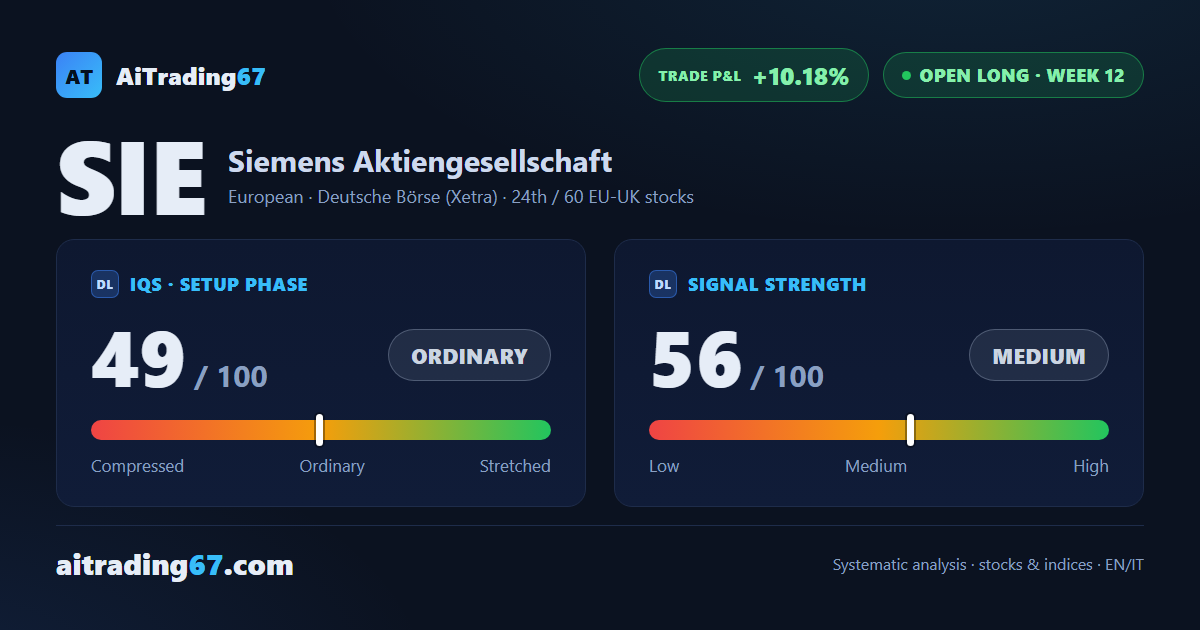
Siemens' weekly moving averages stay bullishly aligned, but this week the stock lost 4% and volume rebalanced, after a prior week dominated by buyers at 97%. Money flow has turned negative, and the price is now boxed into a very tight band, between resistance in the 273.9 area and support in the 272.8 area. Last week the stock was sailing near its all-time highs; now the trade's gain has slipped to 10.18%.
IQS Phase
49
ordinary
Signal Strength
56
medium
Sizing
STANDARD
Ranking
#24 / 60
EU-UK stocks in progress
Trade P&L %
+10.18%
from signal to today
restricted Platinum content