
Siemens, week 13: the buy signal loses steam
Siemens falls 3%: the buy signal cools as RSI and momentum ease off
Siemens, week 13: the buy signal loses steam
Our view last week
Siemens' weekly moving averages stay bullishly aligned, but this week the stock lost 4% and volume rebalanced, after a prior week dominated by buyers at 97%. Money flow has turned negative, and the price is now boxed into a very tight band, between resistance in the 273.9 area and support in the 272.8 area. Last week the stock was sailing near its all-time highs; now the trade's gain has slipped to 10.18%.
This week's summary
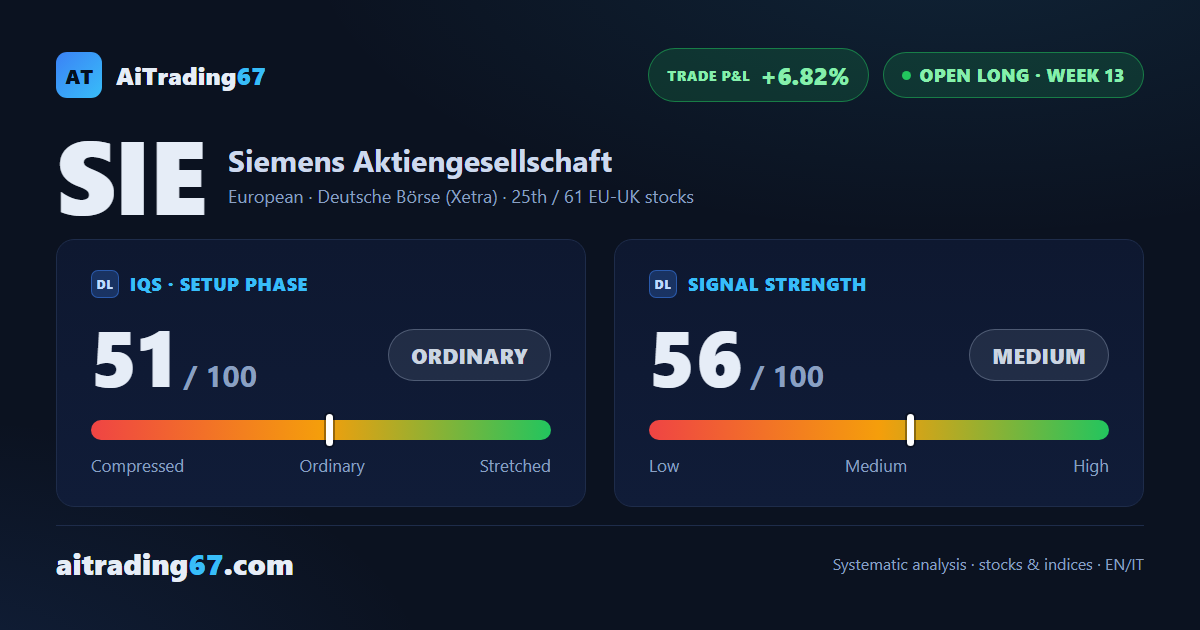
Siemens lost more ground this week, -3%, the fourth straight week of fading upward push: momentum is caving in, money flow has turned negative again, and sellers are back in control of the tape. Price is boxed into a tight band, between resistance in the 267.1 area and support in the 263.5 area — a rung lower than last week, when the band still sat near the all-time highs. The trade's gain has slipped to 6.82%.
IQS Phase
51
ordinary
Signal Strength
56
medium
Sizing
STANDARD
Ranking
#25 / 61
EU-UK stocks in progress
Trade P&L %
+6.82%
from signal to today
restricted Platinum content