
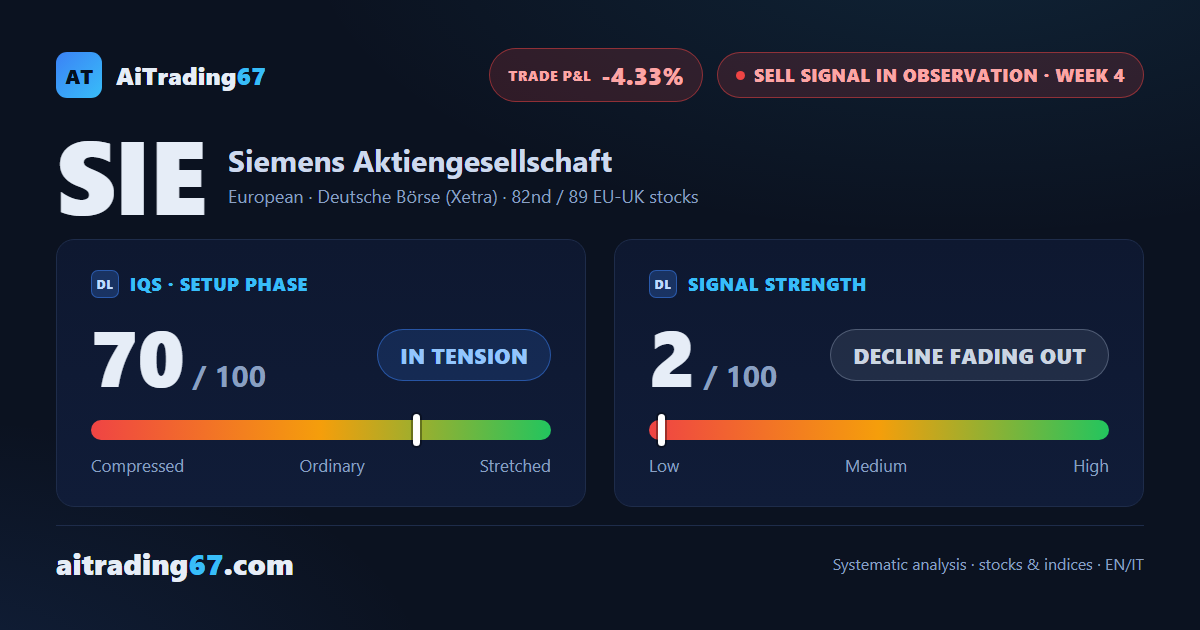
Sell signal in observation · week 4
Siemens slips 0.8% as the push above the Inversion Point fails at the weekly close
Our view last week
A week ago the 20-day moving average was holding Siemens back; this week it became the springboard: the stock touched it in the 272 area and bounced, closing the week up 5.4%. Siemens stock is now back near the Inversion Point, and the Sell signal's strength collapses to 2 out of 100, a decline fading out. One price action caveat remains: only 34% of the last session's volume was on the buy side.
This week's summary
Siemens tried to push past the Inversion Point and couldn't hold it: a new 7-day high in the 286 area, then a weekly close down 0.8%. After last week's bounce, Siemens stock is still resting on its 20- and 50-day averages, in the 273.5 area. In our weekly technical analysis the Sell signal remains a decline fading out, with signal strength stuck at 2 out of 100: a trade setup the market has not confirmed.
IQS Phase
70
in tension
Signal Strength
2
decline fading out
Sizing
MINIMUM
Ranking
#82 / 89
EU-UK stocks sell signals
Trade P&L %
-4.33%
from signal to date, no stop loss
Siemens (SIE) weekly chart — EMA50 · MACD · VWAP
Weekly chart · EMA50 · MACD · VWAP · Source: TradingView
Rank position
ranks 82nd among the 89 sell signals for European-UK stocks in our ranking, with a signal strength of 2 out of 100.
Sector context
SectorEuropean
Benchmark ETFEXH4
Sector regimeweak phase
Performanceweekly -0.03% · monthly +0.15%
SIE belongs to the european sector (reference ETF EXH4). The sector is classified weak phase according to our weekly reading.
restricted Platinum content