
EN IT

SLB Limited: bearish turn confirmed, the 50-52 area becomes a wall

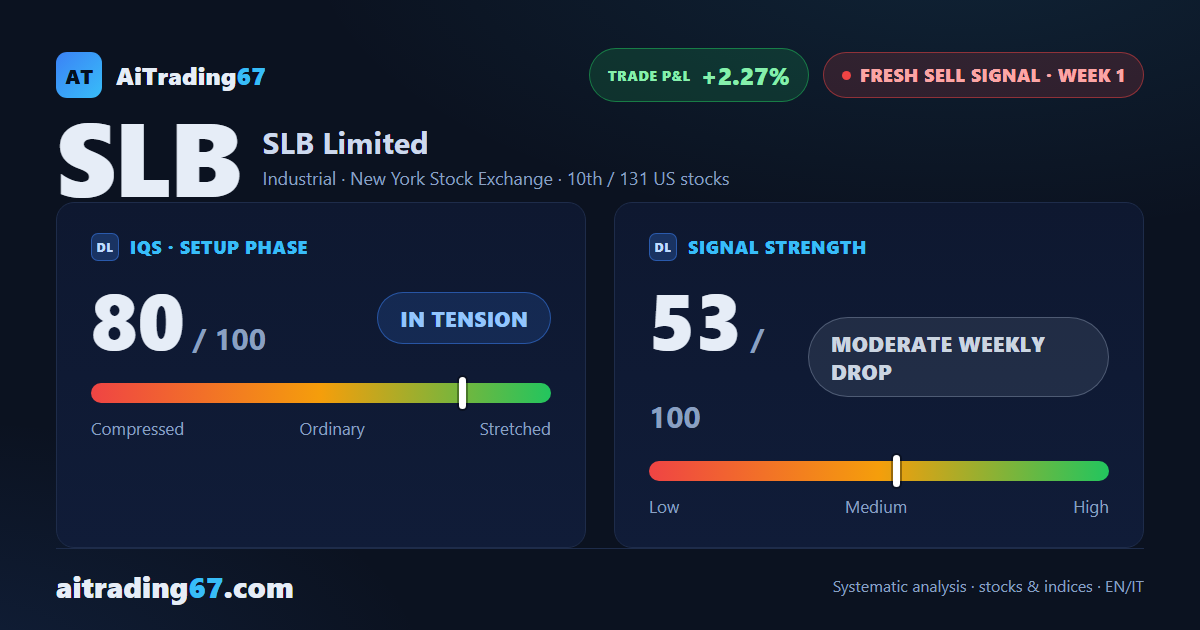
SLB Limited weekly technical analysis — sell signal week 1, setup quality indicator at 80, trading not recommended per our model despite a strong sell rank (10th among 131 US sell signals).

SLB Limited: bearish turn confirmed, the 50-52 area becomes a wall
Sell signal — week 1
SLB Limited: bearish turn confirmed, the 50-52 area becomes a wall
June 26, 2026
Sell signal — week 1
In Summary
A new sell signal is underway on SLB Limited, week 1. The setup quality indicator stands at 80 out of 100, in tension; signal strength at 53 out of 100 reflects a moderate weekly drop. The stock ranks 10th among 131 US sell signals. However, our model flags trading as not recommended: SLB remains more than 7% above the 200-week moving average, a condition that keeps risk elevated.
Fresh sell signal ·1st week from start ·US stocks ·T2 ★ See Gold version →
IQS Phase
80
in tension
Signal Strength
53
moderate weekly drop
Sizing
STANDARD
Ranking
#10 / 131
New us stocks
Trade P&L %
+2.27%
from signal to today
Chart · Weekly — EMA50 · MACD · VWAP
Weekly chart · EMA50 · MACD · VWAP · Source: TradingView
How to read this pageA visual guide to the post, card by card
The full analysis, operating plan and detailed levels on this asset are reserved for clients ★ PLATINUM
restricted Platinum content
Share WhatsApp Telegram Gmail LinkedIn