
SLB bounces 5.8%, the sell signal loses steam
SLB bounces 5.8% off a double bottom as the sell signal cools
SLB bounces 5.8%, the sell signal loses steam
Our view last week
SLB is in week 3 of a sell signal, and the week just closed down 4.0%: the decline keeps making lower lows, consistent with a weekly structure that stays bearish. The stock ranks 31st among the 137 US sell signals, but our model flags trading not recommended on a highly volatile name: better to watch than to force an entry.
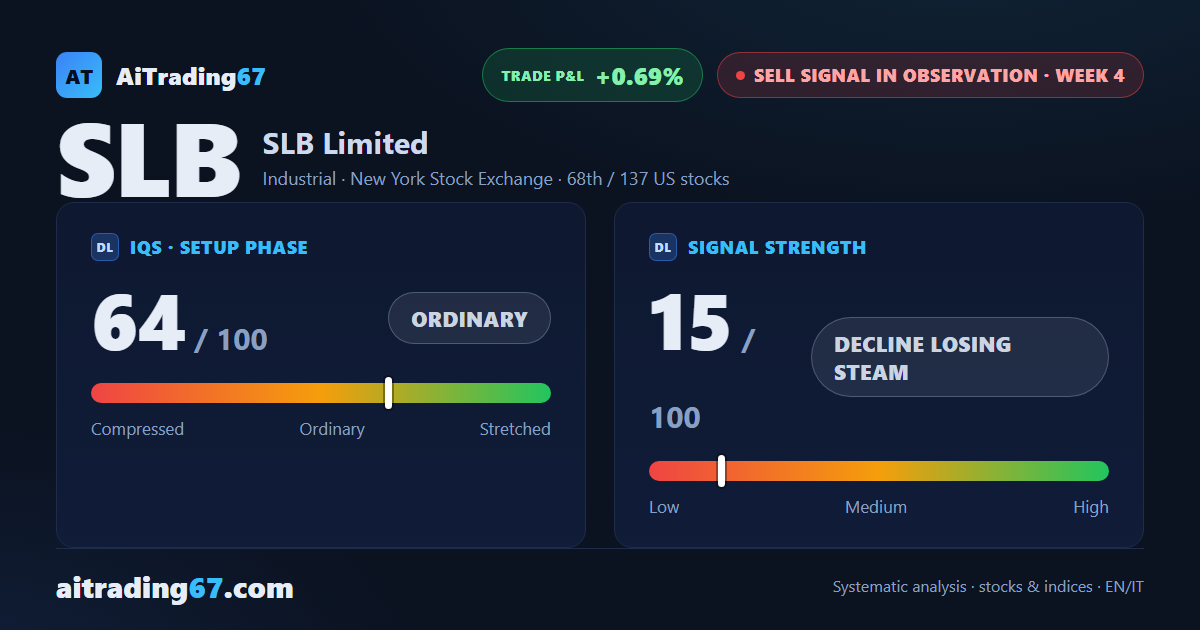
This week's summary
SLB shares bounce 5.8% off a clean double bottom in the 45 area, and the sell signal — which last week kept making lower lows — loses its push for now: signal strength drops to 15 out of 100. The bounce comes on contracting volume and still-heavy distribution, a shift worth watching in our weekly technical analysis, with trading not recommended on a highly volatile name.
Sell signal in observation
·4th week from start
·US stocks
·T2
·📅 Earnings · Jul 24
★ See Gold version →
IQS Phase
64
ordinary
Signal Strength
15
decline losing steam
Sizing
MINIMUM
Ranking
#68 / 137
US stocks sell signals
Trade P&L %
+0.69%
from signal to today
restricted Platinum content