
SLB: the bounce fades as sellers return
SLB slips 1.6% as the bounce loses steam and sellers return
SLB: the bounce fades as sellers return
Our view last week
SLB shares bounce 5.8% off a clean double bottom in the 45 area, and the sell signal — which last week kept making lower lows — loses its push for now: signal strength drops to 15 out of 100. The bounce comes on contracting volume and still-heavy distribution, a shift worth watching in our weekly technical analysis, with trading not recommended on a highly volatile name.
This week's summary
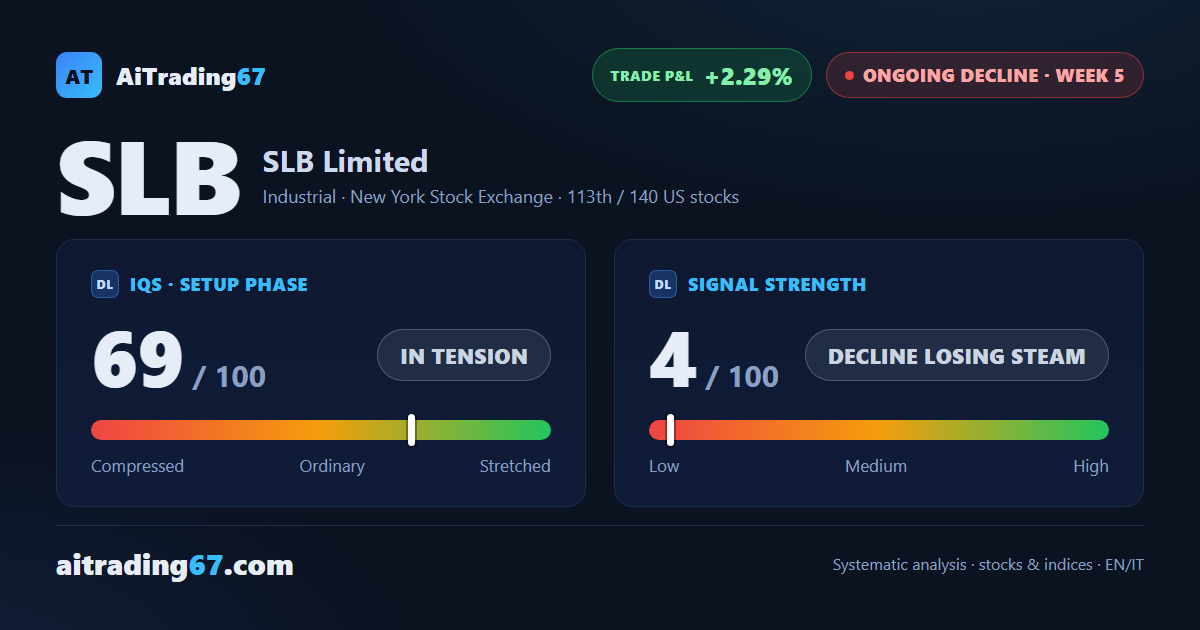
SLB shares slip back: after last week's 5.8% bounce, this week the stock gives back 1.6% and sellers retake control, with 75% of volume on the sell side and an extreme sellers' dominance on the last bar. The double bottom in the 45 area still holds, but our weekly technical analysis on SLB notes the bounce has already lost its push: distribution deepens and buyer dominance collapses.
IQS Phase
69
in tension
Signal Strength
4
decline losing steam
Sizing
MINIMUM
Ranking
#113 / 140
US stocks
Trade P&L %
+2.29%
from signal to today
restricted Platinum content