
First confirmation closes lower, stop near breakeven
SLB stock drops 5.4% in the first confirmation week of its buy signal
First confirmation closes lower, stop near breakeven
Our view last week
SLB shares rebound 11.6% off a clean double bottom in the 45 area, and our weekly technical analysis marks the birth of a fresh buy signal, second among the seven new US Longs. The rally lands right on earnings day, with 94% of the last session's volume on the buy side: a convinced setup, but confirmation only comes with next week's close.
This week's summary
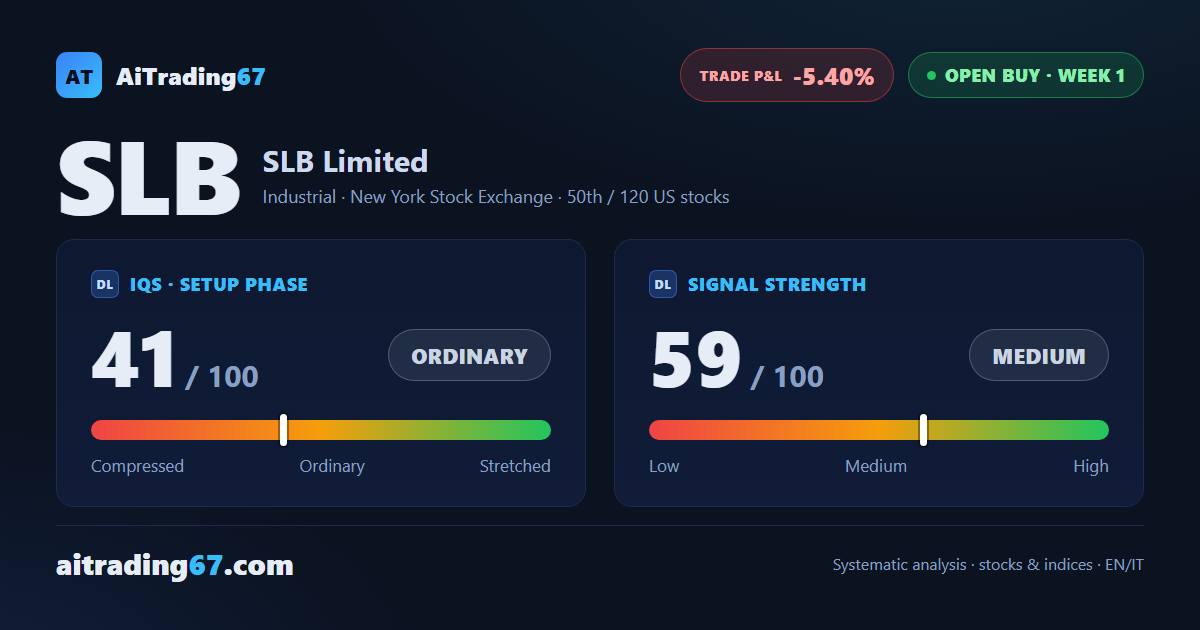
SLB shares bounce 2% off their 20-day moving average, in the 49 area, after touching the 48 area: our technical analysis flags a support level holding on the daily chart. On the weekly chart, though, the first confirmation week of the buy signal closes down 5.4%, with slightly prevalent sellers and rising distribution: the confirmation itself points toward exiting. The stop, meanwhile, has already tightened to near breakeven.
IQS Phase
41
ordinary
Signal Strength
59
medium
Sizing
STANDARD
Ranking
#50 / 120
US stocks in progress
Trade P&L %
-5.40%
from signal to date, no stop loss
Rank position
ranks 50th among the 120 Longs already running for US stocks in our ranking, with a signal strength of 59 out of 100.
Sector context
SectorIndustrial
Benchmark ETFXLI
Sector regimein positive regime
Performanceweekly -1.54% · monthly -1.92%
SLB belongs to the industrial sector (reference ETF XLI). The sector is classified in positive regime according to our weekly reading.
restricted Platinum content