
Sell signal, week 3: the decline picks up again
SLB drops 5.4%, slips under its 50-week average and sets a fresh 30-day low
Our view last week
SLB stock's price action still leans lower: 4 lower highs on the daily chart since August 31, from 60 down to 53, and the weekly MACD crossing to the downside, even as the week closes up 0.8%. The sell signal that fired last week has lost momentum, though: signal strength, at its peak back then, now describes a decline losing steam. In technical analysis terms, the confirmation week's verdict is still open, and trading remains not recommended.
This week's summary
Turned back by the cluster of moving averages in the 52 area, SLB stock drops 5.4% and slips under its 50-week average, setting a fresh 30-day low. A week ago the sell signal looked short of new push; now the price action describes a decline starting to make lower lows, with the weekly MACD below its Signal line and money flow negative. In technical analysis terms it is a trade setup to follow week by week: among US stocks, opening a short here is still not recommended.
Sell signal in observation
·3rd week from start
·US stocks
·T2
·📅 Earnings · Oct 23
★ See Gold version →
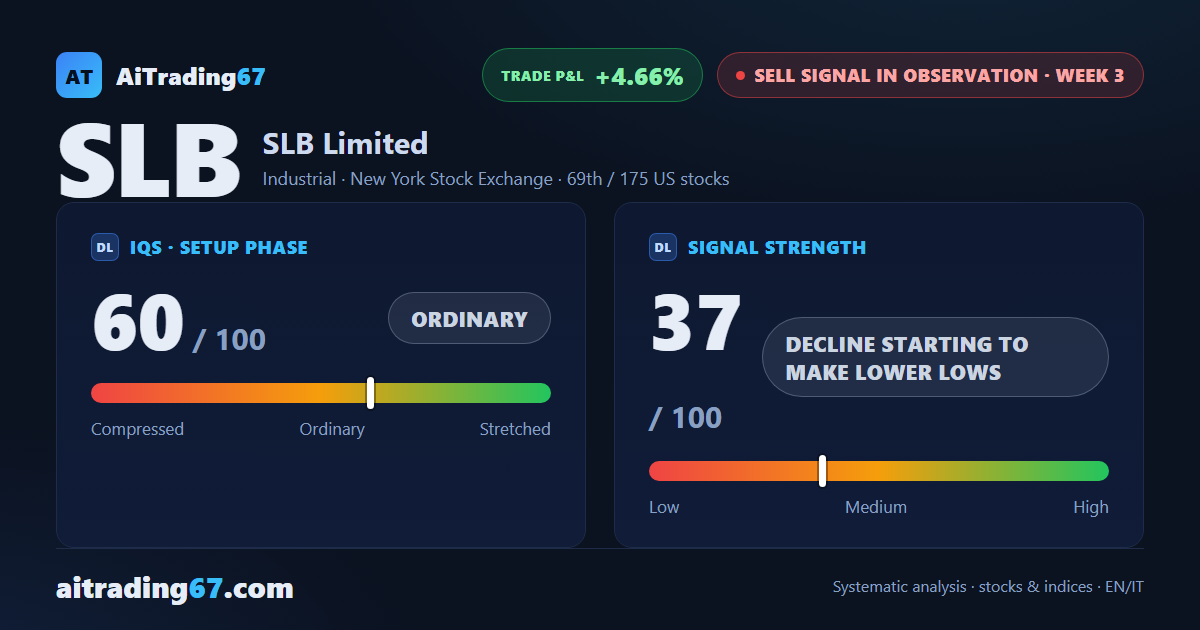
IQS Phase
60
ordinary
Signal Strength
37
decline starting to make lower lows
Sizing
REDUCED
Ranking
#69 / 175
US stocks sell signals
Trade P&L %
+4.66%
from signal to date, no stop loss
Rank position
ranks 69th among the 175 sell signals for US stocks in our ranking, with a signal strength of 37 out of 100.
Sector context
SectorIndustrial
Benchmark ETFXLI
Sector regimeweak phase
Performanceweekly -0.28% · monthly -1.64%
SLB belongs to the industrial sector (reference ETF XLI). The sector is classified weak phase according to our weekly reading.
restricted Platinum content