
Sell signal · week 21
Snam gains 0.5% and holds its 100-week average as money flow keeps weakening
Our view last week
On Snam stock the buyers vanished in a single week: after taking 84% of the volume seven days ago, this time they stopped at 24%, and the price closed flat, down 0.1%. The weekly price action is back to flagging distribution, money flow has sat below zero for 5 weeks and the ADX has climbed for a 9th straight week. In technical analysis terms, last week's rebound found no follow-through, and the sell signal stands 9.8% in the money.
This week's summary
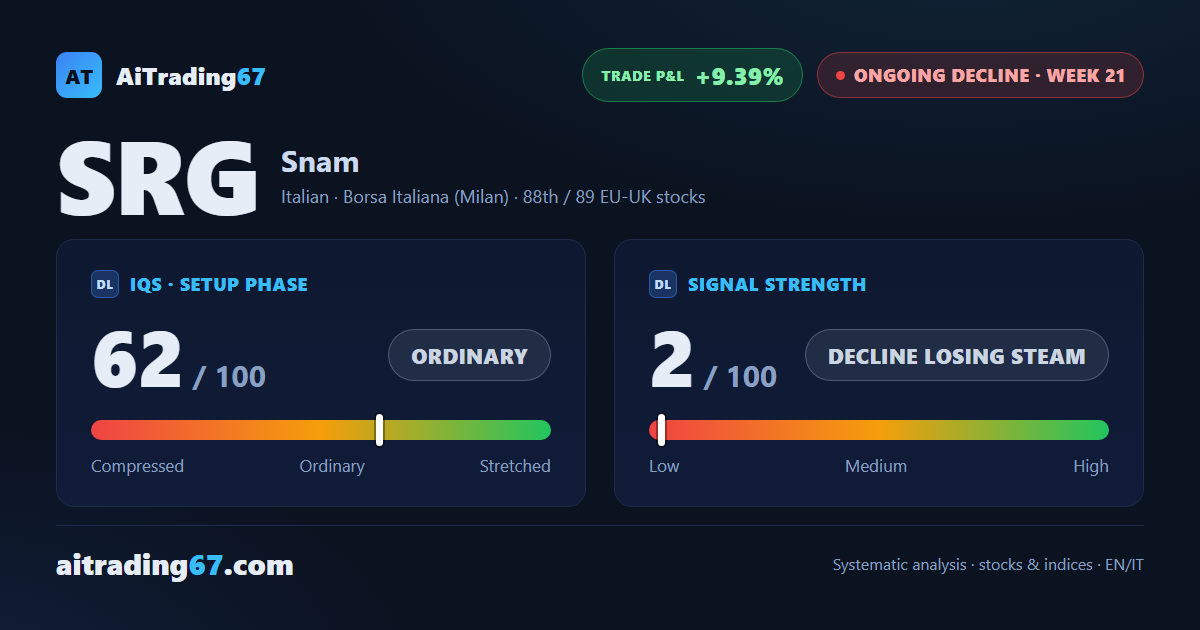
In a single week Snam printed a new 7-day low and a new 7-day high, and the weekly close confirmed neither: what is left is a 0.5% gain and an indecisive price action. A week ago the rebound had found no follow-through, and the picture holds: this technical analysis of Snam stock shows money flow below zero for 6 weeks and weakening, while the ADX rises for a 10th straight week. The sell signal stands 9.4% in profit since the opening.
IQS Phase
62
ordinary
Signal Strength
2
decline losing steam
Sizing
MINIMUM
Ranking
#88 / 89
EU-UK stocks
Trade P&L %
+9.39%
from signal to date, no stop loss
Snam (SRG) weekly chart — EMA50 · MACD · VWAP
Weekly chart · EMA50 · MACD · VWAP · Source: TradingView
Rank position
ranks 88th among the 89 sell signals for European-UK stocks in our ranking, with a signal strength of 2 out of 100.
Sector context
SectorItalian
Benchmark ETFEXH9
Sector regimein positive regime
Performanceweekly +0.55% · monthly +1.10%
SRG belongs to the italian sector (reference ETF EXH9). The sector is classified in positive regime according to our weekly reading.
restricted Platinum content