
Sandisk: a technical bounce, but the momentum is fading
Sandisk bounces 9.8% off a double bottom, but momentum has been fading for a month
Sandisk: a technical bounce, but the momentum is fading
Our view last week
Sandisk is in week 44 of a buy signal that has exhausted the model's coverage: all 3 targets have been hit and the stop now follows the Inversion Point, in the 1760 area. The trade is deep in profit after many weeks. On the technical side, the week closed down 16.5%, with sell volume at 91% - a first sign of fatigue after 3 weeks of strong upside.
This week's summary
Sandisk shares close the week up 9.8%, with buyers back in control of volume at 92%, after last week's 16.5% slide. The bounce comes off a clean double bottom in the 1500 area. In this week's technical picture, though, money flow and momentum have been fading for a month even as price climbs: an early sign of fatigue beneath the surface. The trade is now in its 45th week, sitting well above 3,500% in profit.
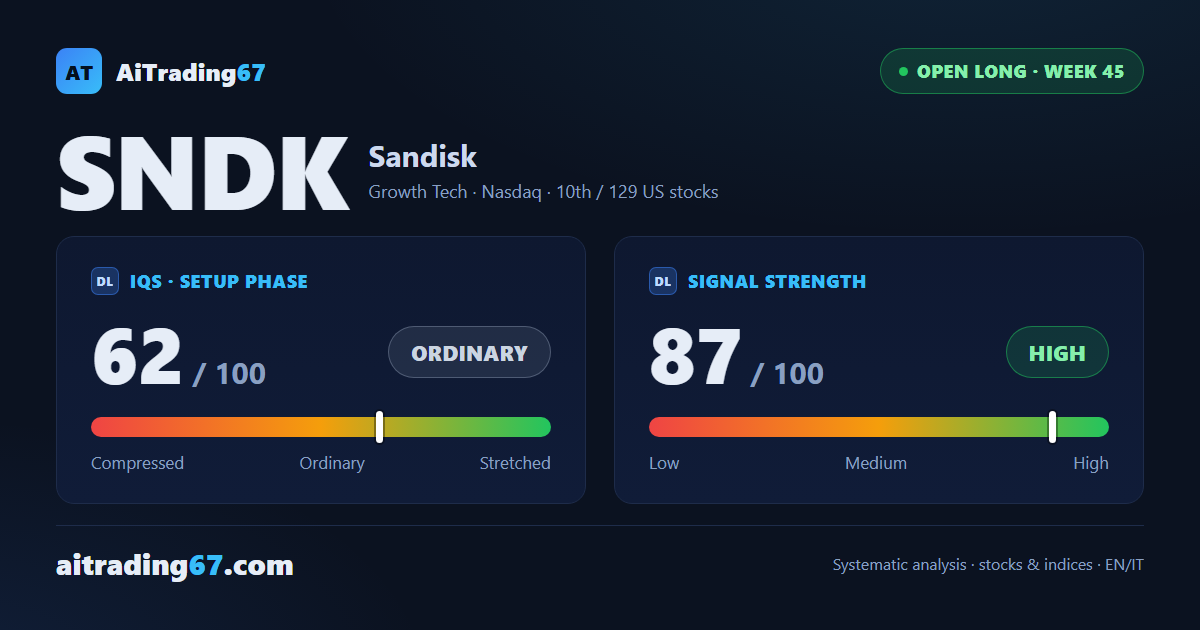
IQS Phase
62
ordinary
Signal Strength
87
high · wide & volatile
Sizing
FULL
Ranking
#10 / 129
US stocks in progress
restricted Platinum content