
Sell signal at week 3 — market sideways, no confirmation yet
SNDL: three observation weeks in, the decline hasn't materialized
Sell signal at week 3 — market sideways, no confirmation yet
In Summary
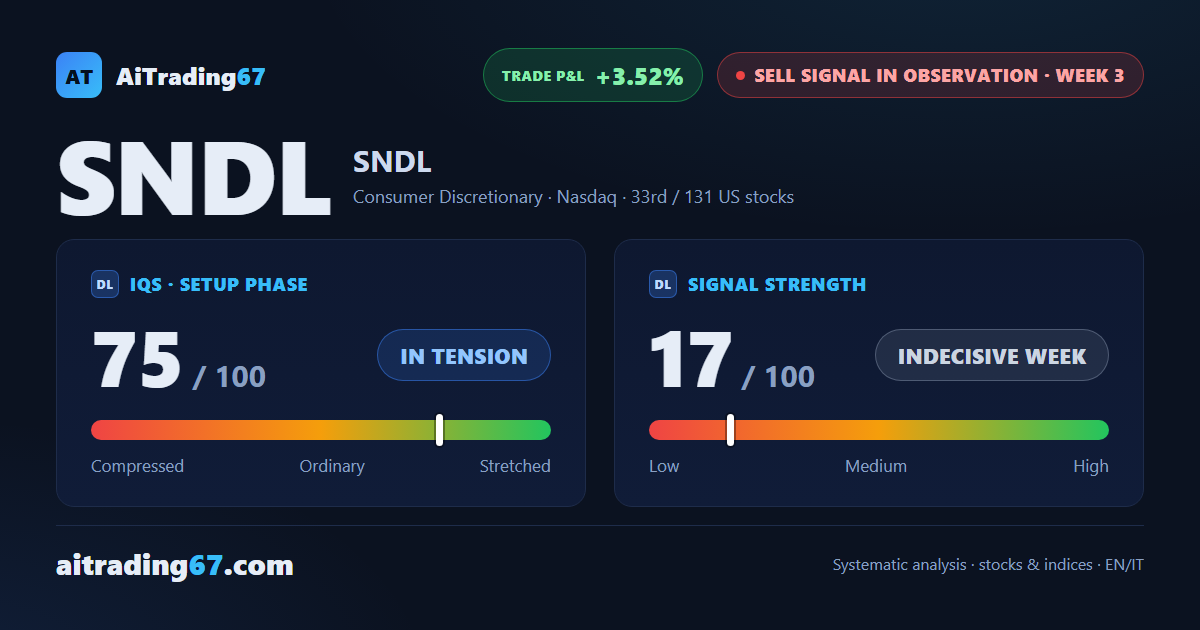
SNDL is at week 3 of a sell signal the market has yet to confirm: 3 weeks closed sideways, no structural decline. The quality-of-setup indicator stands at 75 out of 100, in tension, while signal strength at 17 out of 100 reflects last week's pure indecision. The quality band flags trading not recommended: SNDL ranks 33rd among the 131 US sell signals.
IQS Phase
75
in tension
Signal Strength
17
indecisive week
Sizing
MINIMUM
Ranking
#33 / 131
US stocks sell signals
Trade P&L %
+3.52%
from signal to today
restricted Platinum content