
SNDL: sharp rejection at highs, down 4.7% this week
SNDL drops 4.7% as it's rejected by a wall of resistance near 1.36-1.43
SNDL: sharp rejection at highs, down 4.7% this week
Our view last week
SNDL is in the 5th week of a sell signal, and strength has dropped to 17 out of 100: the decline holds direction but without fresh drive, not yet fair to call it exhausted. The setup quality indicator, at 73 out of 100, stays in tension, and SNDL ranks 54th among the 137 US sell signals. Trading not recommended per our model.
This week's summary
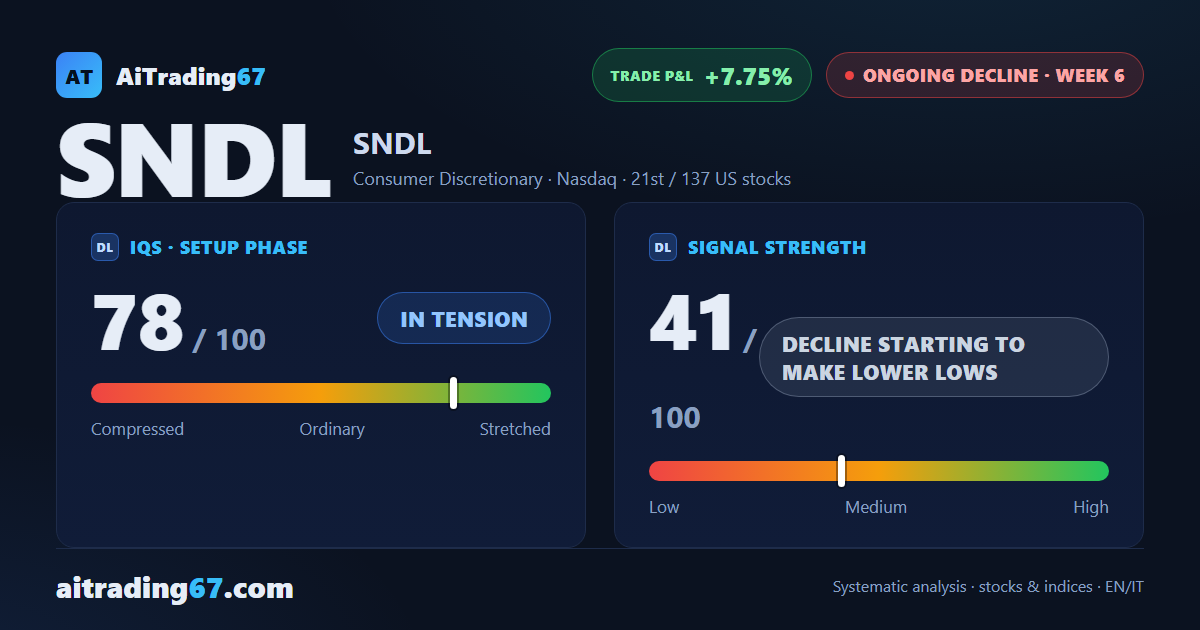
This week SNDL's price action ran straight into the wall of resistance stacked in the 1.36-1.43 area — the 20-day and 50-day averages, the daily VWMA, the Kumo floor — and was firmly rejected at every level, closing the week down 4.7%. After weeks waiting for confirmation, the Sell signal is now fully under management, six weeks in, with the short already up 7.75%: sellers dominate the volume and the RSI slides to a fresh low for the period.
IQS Phase
78
in tension
Signal Strength
41
decline starting to make lower lows
Sizing
REDUCED
Ranking
#21 / 137
US stocks
Trade P&L %
+7.75%
from signal to today
restricted Platinum content