
SNDL: the decline slows, short up 9.86% under management
SNDL drops 2.3% as the decline loses steam near a double bottom
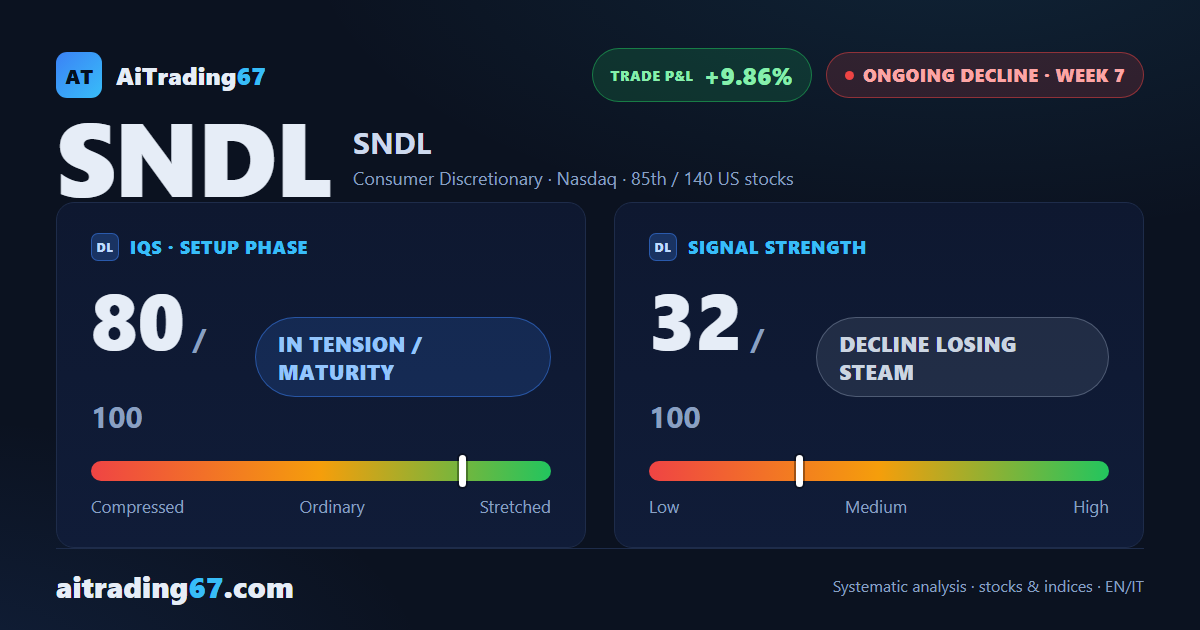
SNDL: the decline slows, short up 9.86% under management
Our view last week
This week SNDL's price action ran straight into the wall of resistance stacked in the 1.36-1.43 area — the 20-day and 50-day averages, the daily VWMA, the Kumo floor — and was firmly rejected at every level, closing the week down 4.7%. After weeks waiting for confirmation, the Sell signal is now fully under management, six weeks in, with the short already up 7.75%: sellers dominate the volume and the RSI slides to a fresh low for the period.
This week's summary
After last week's sharp rejection at the 1.36-1.43 resistance band, which closed down 4.7%, SNDL keeps sliding but with less force: this week it drops 2.3%, and sellers still dominate the tape, with 73% of volume on the sell side. The weekly RSI slips to a fresh low for the period, while price returns to the double bottom around the 1.3 area. The short, six weeks into management, is now up 9.86%.
IQS Phase
80
in tension / maturity
Signal Strength
32
decline losing steam
Sizing
REDUCED
Ranking
#85 / 140
US stocks
Trade P&L %
+9.86%
from signal to today
restricted Platinum content