
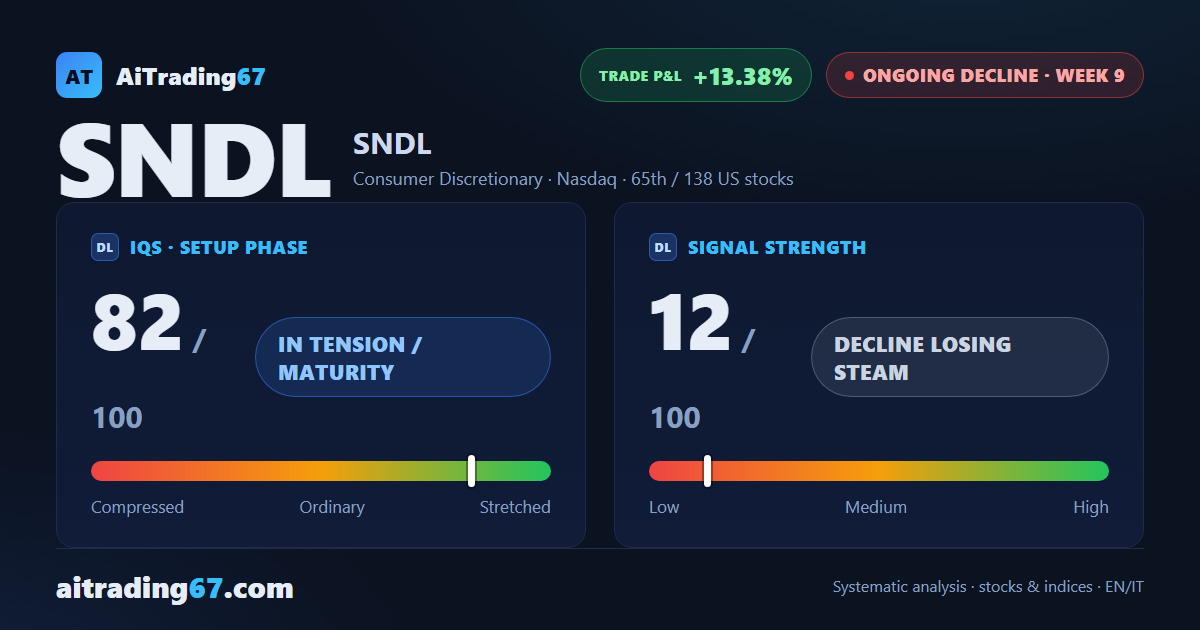
SNDL: the decline slows in its ninth week
SNDL stock slips 1.2% this week as the Sell signal loses its rhythm
SNDL: the decline slows in its ninth week
Our view last week
SNDL keeps sliding, down 2.7% this week, with sellers controlling 90% of volume, the most extreme reading of the last 4 weeks. The weekly RSI prints a fresh low for the period at 33.8, and cash flow (CMF) sinks deeper into distribution. Yet price is back near the 1.24-1.26 double bottom that already sparked a 7% rebound in June: selling pressure is heavy, but this ground has already shown it can bounce.
This week's summary
SNDL's Sell signal is slowing but not stopping: this week's decline eases to 1.2%, after last week's 2.7% drop, and sellers slip to 68% of volume from 90% seven days ago. Under the surface, though, cash flow sinks deeper into distribution and the weekly RSI prints a fresh low at 33.1. Price is still hugging the 1.24-1.26 double bottom that already sparked a rebound in June: technical analysis this week says the decline is still live, just moving slower.
IQS Phase
82
in tension / maturity
Signal Strength
12
decline losing steam
Sizing
MINIMUM
Ranking
#65 / 138
US stocks
Trade P&L %
+13.38%
from signal to date, no stop loss
Rank position
ranks 65th among the 138 sell signals for US stocks in our ranking, with a signal strength of 12 out of 100.
Sector context
SectorConsumer Discretionary
Benchmark ETFXLY
Sector regimein positive regime
Performanceweekly +6.11% · monthly -1.69%
SNDL belongs to the consumer discretionary sector (reference ETF XLY). The sector is classified in positive regime according to our weekly reading.
restricted Platinum content