
Sell signal · week 7
Societe Generale drops 8.3%, loses its 50-week average and sets a new 90-day low
Our view last week
Sellers stay in the majority on Societe Generale stock for a second straight week: after last week's bearish engulfing, the stock gives up another 0.4%, with 59% of volume on the sell side. Technical analysis shows the weekly MACD histogram falling for 6 weeks and price wedged between the daily pivot average in the 72.3 area and the daily VWMA in the 73 area. For swing trading readers, the sell signal keeps the short 5% in profit since entry.
This week's summary
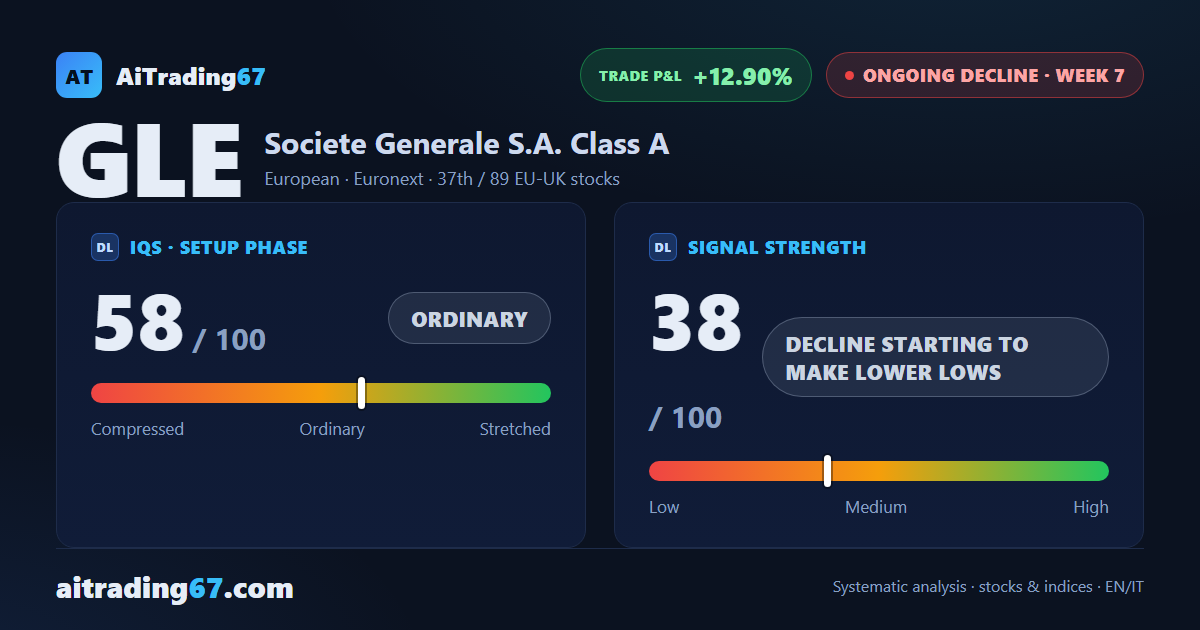
Societe Generale's decline shifts gear: after last week's -0.4% the stock drops 8.3%, loses its 50-week average and sets a new 90-day low. Technical analysis of Societe Generale stock shows the MACD histogram falling for 7 weeks and money flow back in negative territory after 4 weeks above zero, with the daily RSI at 30.5, close to oversold. For swing trading readers, the sell signal now has the short 12.9% in profit since entry.
IQS Phase
58
ordinary
Signal Strength
38
decline starting to make lower lows
Sizing
REDUCED
Ranking
#37 / 89
EU-UK stocks
Trade P&L %
+12.90%
from signal to date, no stop loss
Societe Generale (GLE) weekly chart — EMA50 · MACD · VWAP
Weekly chart · EMA50 · MACD · VWAP · Source: TradingView
Rank position
ranks 37th among the 89 sell signals for European-UK stocks in our ranking, with a signal strength of 38 out of 100.
Sector context
SectorEuropean
Benchmark ETFEXV1
Sector regimeweak phase
Performanceweekly -4.91% · monthly -4.92%
GLE belongs to the european sector (reference ETF EXV1). The sector is classified weak phase according to our weekly reading.
restricted Platinum content