
SoFi confirms its new Buy signal
SoFi climbs 3% and confirms its new Buy signal off a double bottom
SoFi confirms its new Buy signal
Our view last week
SoFi Technologies triggers a fresh buy signal: 2nd among the 10 fresh Longs for US stocks, with a signal strength of 76 out of 100. The picture is high conviction but wide and volatile, to be managed with discipline. Price is squeezed between a nearby resistance and support: entry still awaits confirmation.
This week's summary
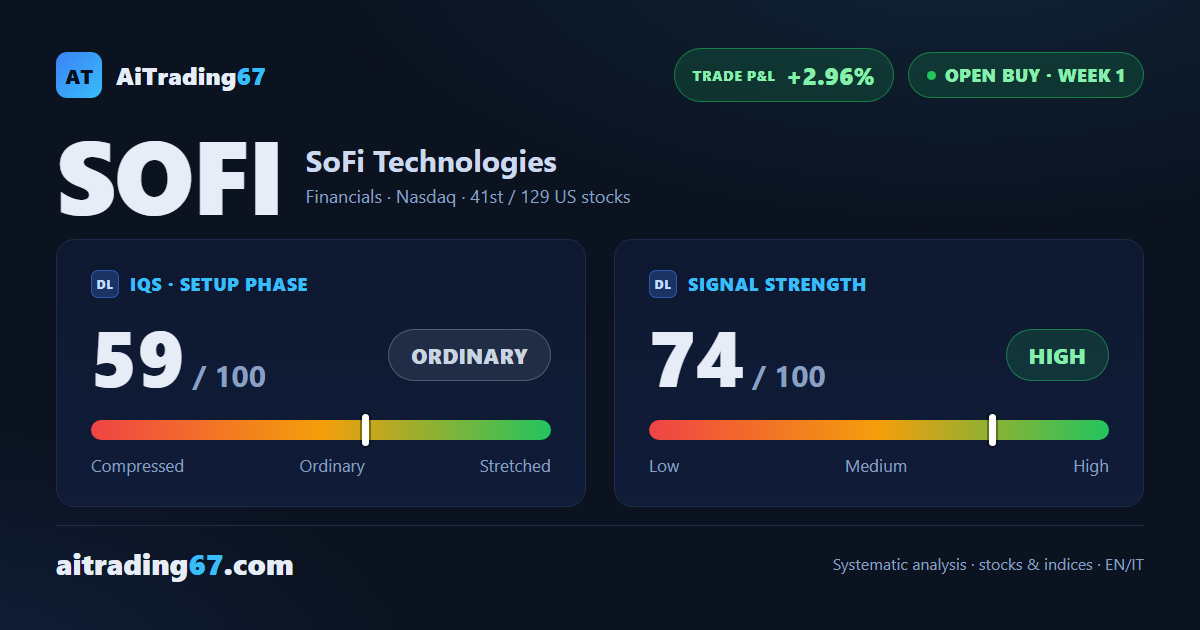
SoFi's weekly technical analysis shows a clean double bottom near 16 and a 20% intermediate rebound: price is up 3%, and the first week of the new Buy signal confirms bullish. The signal ranks 41st among 129 open US buys, in a high-conviction but volatile picture that calls for discipline.
IQS Phase
59
ordinary
Signal Strength
74
high · wide & volatile
Sizing
FULL
Ranking
#41 / 129
US stocks in progress
Trade P&L %
+2.96%
from signal to today
restricted Platinum content