
SoFi: confirmation holds after an 8% weekly drop
SoFi falls 8% this week, but the buy signal's confirmation holds
SoFi: confirmation holds after an 8% weekly drop
Our view last week
SoFi's weekly technical analysis shows a clean double bottom near 16 and a 20% intermediate rebound: price is up 3%, and the first week of the new Buy signal confirms bullish. The signal ranks 41st among 129 open US buys, in a high-conviction but volatile picture that calls for discipline.
This week's summary
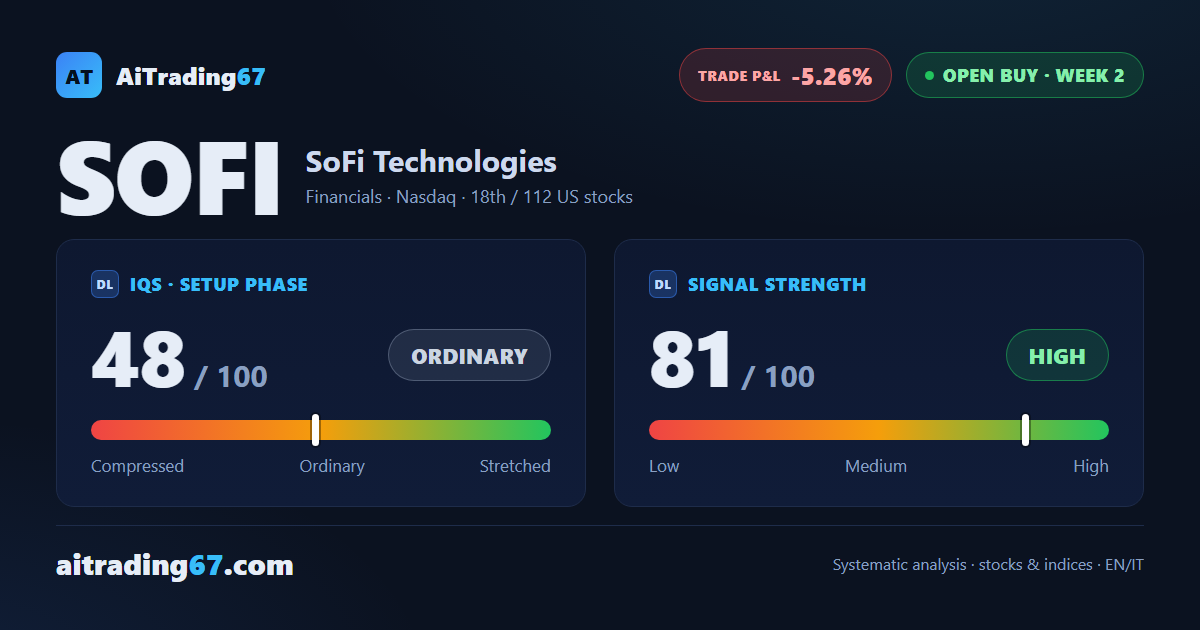
SoFi fell 8% this week, in a structure that's still neutral, with mixed rejection candles. Volume tells a different story: buyers still dominate, over 73% of daily trading. The buy signal, which fired two weeks ago, is holding: confirmation reads positive and our model suggests keeping the position unchanged. This technical analysis has SoFi ranking 18th among 112 open US buy signals, in a financial sector still in a strength phase.
IQS Phase
48
ordinary
Signal Strength
81
high · wide & volatile
Sizing
FULL
Ranking
#18 / 112
US stocks in progress
Trade P&L %
-5.26%
from signal to today
restricted Platinum content