
SoFi, trade in the red in week 4
SoFi stock: down 0.9% on four lower highs, trade in the red in its 4th week
SoFi, trade in the red in week 4
Our view last week
SoFi shares slip 4.7% this week, but the price action tells a fuller story: a clean double bottom in the 16 area, with a 26% intermediate rebound. The latest bar is more cautious, though - sellers dominated to an extreme and buyer dominance is clearly collapsing. The buy signal, which fired three weeks ago, holds: confirmation reads positive and our model suggests keeping the position unchanged. This SoFi technical analysis has it ranking 15th among 124 open US buy signals.
This week's summary
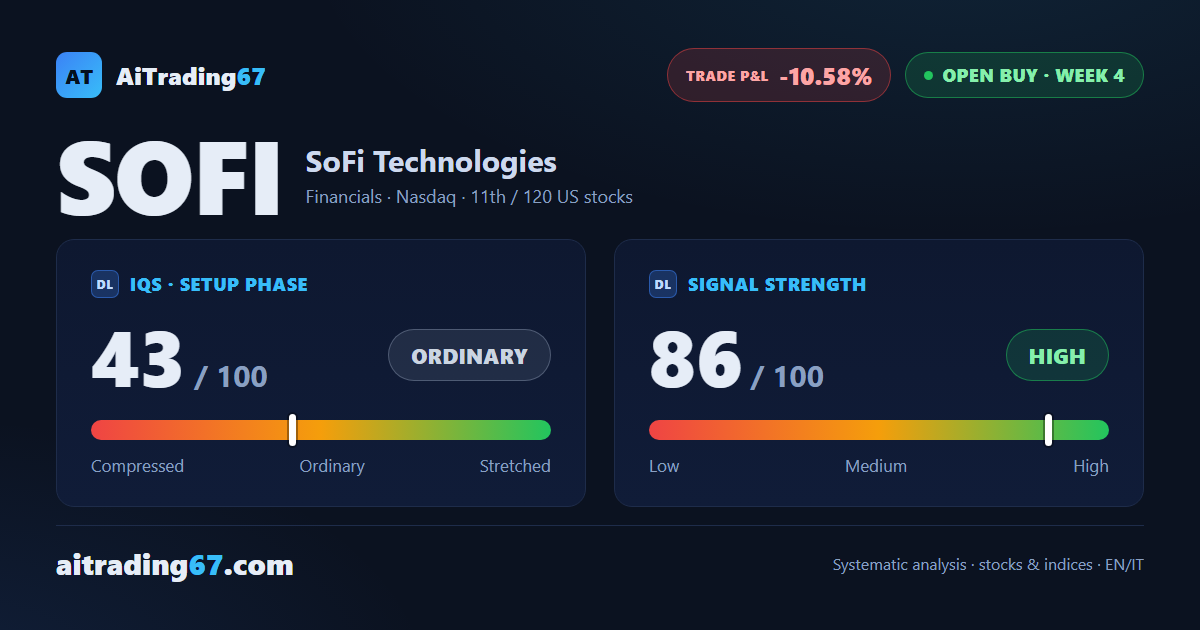
SoFi stock stays boxed into a tight range, between a daily pivot just above (the 16.45 area) and one just below (the 16.21 area): the week closes down 0.9%, with a run of four lower highs, from the 20 area toward 18. The trade, in its 4th week, shows a -10.58% loss from entry, with the stop fixed on the weekly signal level. Earnings, out last week, are now behind it. This SoFi technical analysis has it ranking 11th among the 120 US buy signals still running.
IQS Phase
43
ordinary
Signal Strength
86
high · wide & volatile
Sizing
FULL
Ranking
#11 / 120
US stocks in progress
Trade P&L %
-10.58%
from signal to date, no stop loss
Rank position
ranks 11th among the 120 Longs already running for US stocks in our ranking, with a signal strength of 86 out of 100.
Sector context
SectorFinancials
Benchmark ETFXLF
Sector regimein strong phase
Performanceweekly +1.12% · monthly +3.94%
SOFI belongs to the financials sector (reference ETF XLF). The sector is classified in strong phase according to our weekly reading.
restricted Platinum content