
SOXX sell signal, third week
SOXX, the semiconductor ETF, sheds 4.2% as the sell signal stays under watch
SOXX sell signal, third week
This week's summary
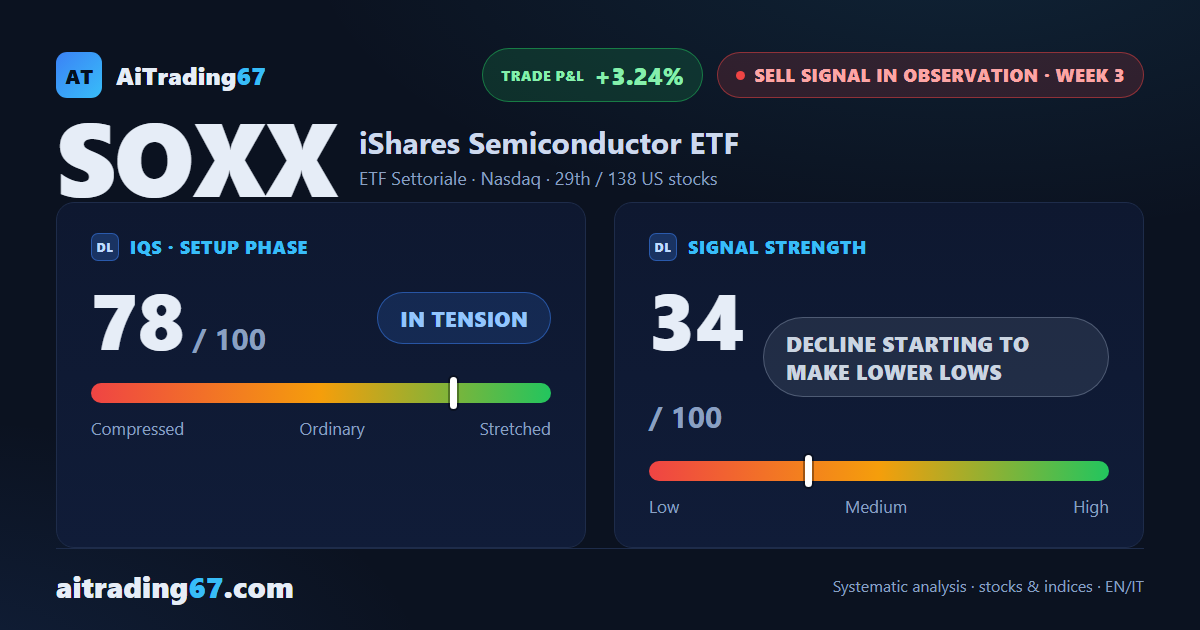
SOXX, the semiconductor ETF, shed 4.2% this week: technical analysis shows the price back in the 499 area it had already touched, but no session has defended it yet — for now the move under way continues. Flows stay negative, with only 11% of daily volume on the buy side and money flow in distribution. The sell signal, now in its third week, stays under observation: the confirmation week hasn't closed yet.
Sell signal in observation
·3rd week from start
·US stocks
·T2
IQS Phase
78
in tension
Signal Strength
34
decline starting to make lower lows
Sizing
REDUCED
Ranking
#29 / 138
US stocks sell signals
Trade P&L %
+3.24%
from signal to date, no stop loss
Rank position
ranks 29th among the 138 sell signals for US stocks in our ranking, with a signal strength of 34 out of 100.
Sector context
SectorETF Settoriale
Benchmark ETFXLK
Sector regimeweak phase
Performanceweekly -0.30% · monthly -5.53%
SOXX belongs to the etf settoriale sector (reference ETF XLK). The sector is classified weak phase according to our weekly reading.
restricted Platinum content