
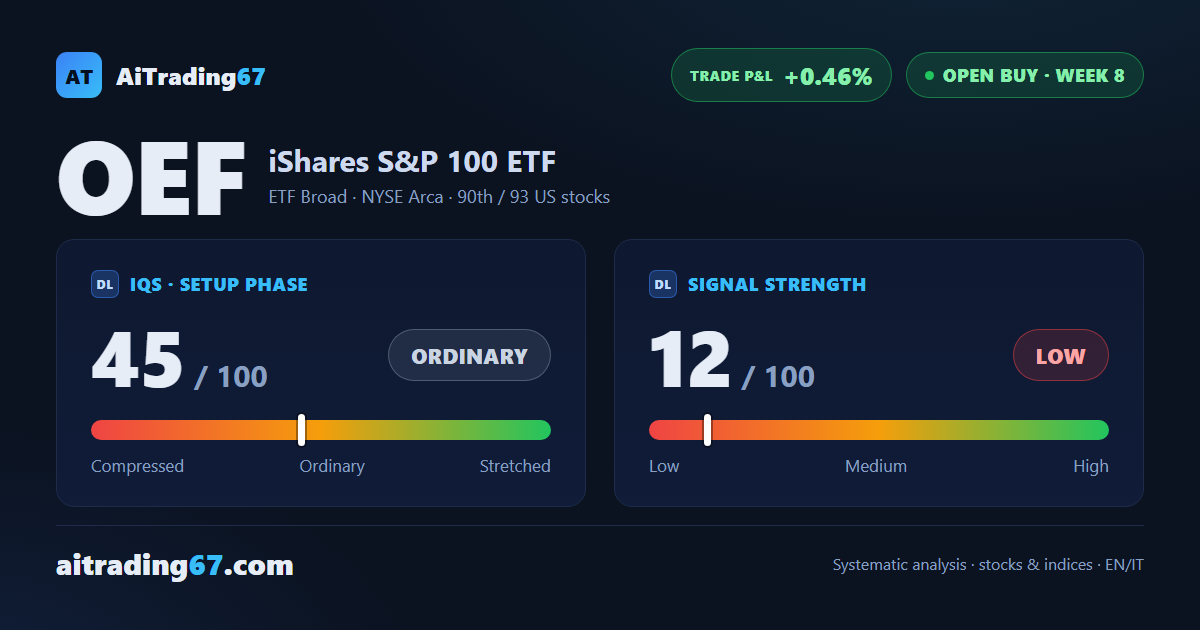
OEF · Open buy, week 8
OEF slips 0.3% as the weekly MACD drops back below its Signal line near record highs
Our view last week
The weekly MACD is back above its Signal line after just one week below, mending the crack that opened seven days ago. OEF, the ETF tracking the 100 largest US companies, closed the week up 1.6% and sits half a percentage point below its record highs, tested 6 times in 10 weeks. Our OEF technical analysis stays cautious, though: OEF is still among our weekly buy signals, but its push is low and fading, and the weekly price action shows an indecisive phase.
This week's summary
The weekly MACD is back below its Signal line a week after recovering: on OEF, the ETF tracking the 100 largest US companies, the indicator has changed direction for the 3rd week running. The week closed down 0.3%, with indecisive price action and price less than 1% below record highs, approached again without being cleared. Our OEF technical analysis turns more cautious: OEF stays among our weekly buy signals, but the push is low and setup quality is slipping.
IQS Phase
45
ordinary
Signal Strength
12
low · fading
Sizing
MINIMUM
Ranking
#90 / 93
US stocks in progress
Trade P&L %
+0.46%
from signal to date, no stop loss
S&P 100 (OEF) weekly chart — EMA50 · MACD · VWAP
Weekly chart · EMA50 · MACD · VWAP · Source: TradingView
Rank position
ranks 90th among the 93 Longs already running for US stocks in our ranking, with a signal strength of 12 out of 100.
Sector context
SectorETF Broad
Benchmark ETF—
Sector regime
Performanceweekly coming soon · monthly coming soon
OEF belongs to the etf broad sector (reference ETF ).
restricted Platinum content