EN IT

Virgin Galactic: weekly sell signal meets a daily double bottom

Virgin Galactic stock weekly technical analysis — fresh sell signal, week 1. IQS 54, elevated volatility, trading not recommended. A daily double bottom with a 31% rebound creates uncertainty around short entries.

Virgin Galactic: weekly sell signal meets a daily double bottom
Sell signal · week 1
Virgin Galactic: weekly sell signal meets a daily double bottom
June 19, 2026
Sell signal · week 1
In Summary
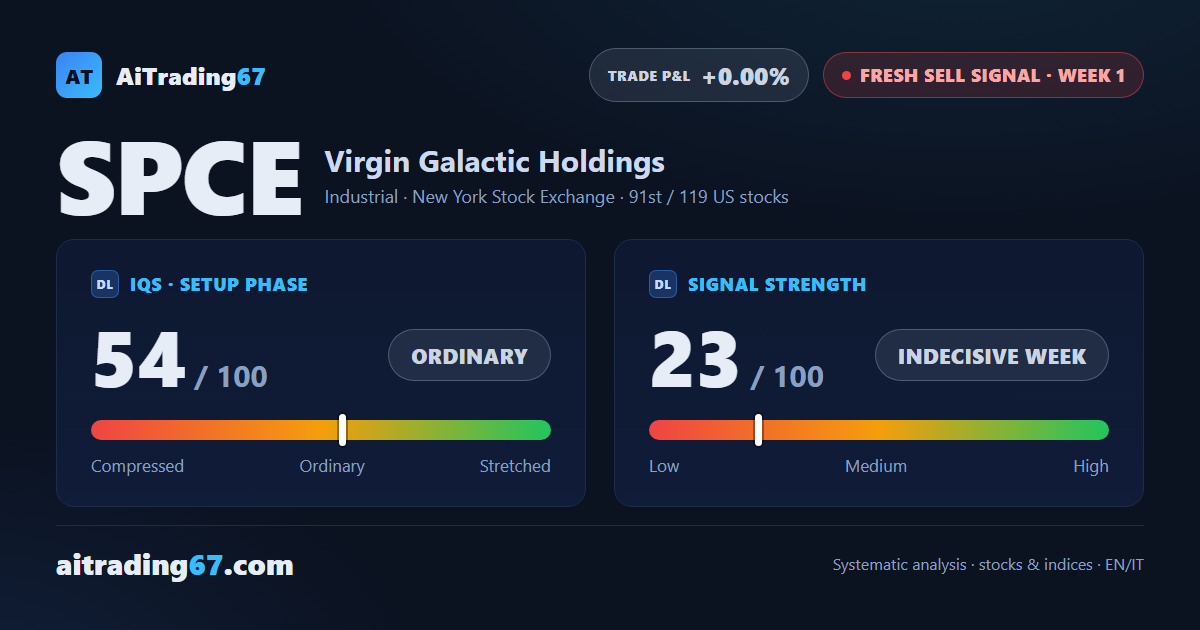
Virgin Galactic Holdings receives a fresh weekly sell signal at week 1, with an intermediately bearish weekly structure and setup quality index at 54 out of 100. Signal strength flags an indecisive week, but technical warnings remain active. The quality band marks trading as not recommended: a daily double bottom — with a 31% intermediate rebound — adds complexity to what the weekly signal alone would suggest.
Fresh sell signal ·1st week from start ·US stocks ·T2 ★ See Gold version →
IQS Phase
54
ordinary
Signal Strength
23
indecisive week
Sizing
MINIMUM
Ranking
#91 / 119
New us stocks
Trade P&L %
+0.00%
from signal to today
Chart · Weekly — EMA50 · MACD · VWAP
Weekly chart · EMA50 · MACD · VWAP · Source: TradingView
How to read this pageA visual guide to the post, card by card
The full analysis, operating plan and detailed levels on this asset are reserved for clients ★ PLATINUM
restricted Platinum content
Share WhatsApp Telegram Gmail LinkedIn