
The decline breaks to new lows
Virgin Galactic falls 4.8% and hits a fresh low, despite a 27% rebound
The decline breaks to new lows
Our view last week
Virgin Galactic is in the 3rd week of a sell signal: the week just closed gave up 8.5%, without breaking below prior lows, and the signal strength sits mid-scale at 48 out of 100. The setup quality indicator at 82 out of 100 points to a structure still in tension of maturity, on a highly volatile name. The model continues to flag this as not recommended for opening.
This week's summary
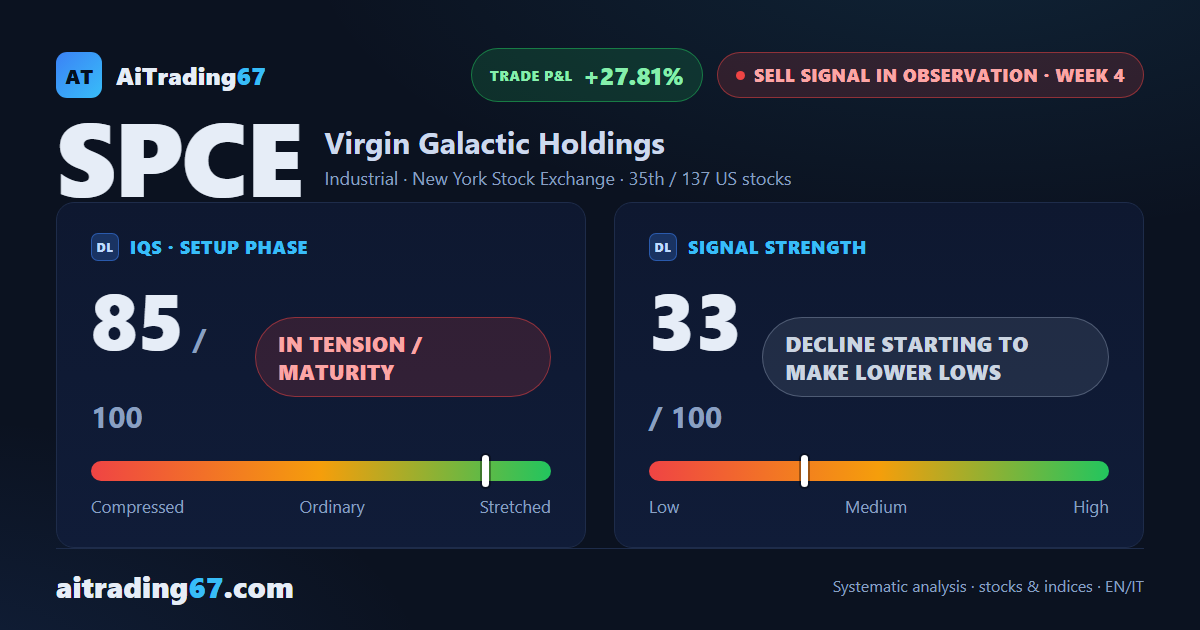
Last week Virgin Galactic fell 8.5% without breaking below its prior lows; this time the breakdown came, with a fresh 30-day low in the 2.47 area and a 27% intraday rebound that wasn't enough to save the week from closing down 4.8%. This week's technical analysis of Virgin Galactic stock keeps the picture weak — MACD just turned bearish, ADX rising, sellers still in control — and the sell signal, now in its 4th week, stays under watch.
Sell signal in observation
·4th week from start
·US stocks
·T2
·📅 Earnings · Jul 30
★ See Gold version →
IQS Phase
85
in tension / maturity
Signal Strength
33
decline starting to make lower lows
Sizing
REDUCED
Ranking
#35 / 137
US stocks sell signals
Trade P&L %
+27.81%
from signal to today
restricted Platinum content