
Fresh sell signal, range still tight
SPDW slips 1.8%: a fresh sell signal opens, but the long-term trend stays bullish
Fresh sell signal, range still tight
Our view last week
Buyers took back control on SPDW this week, with buy volume jumping to 68% after a week of near-balance. The catch sits in the MACD histogram, just turned negative, while the ADX keeps fading: the trend is losing conviction. Price stays boxed between support in the 50.3 area and resistance in the 50.4 area, with the trade still running at +4.4% since entry.
This week's summary
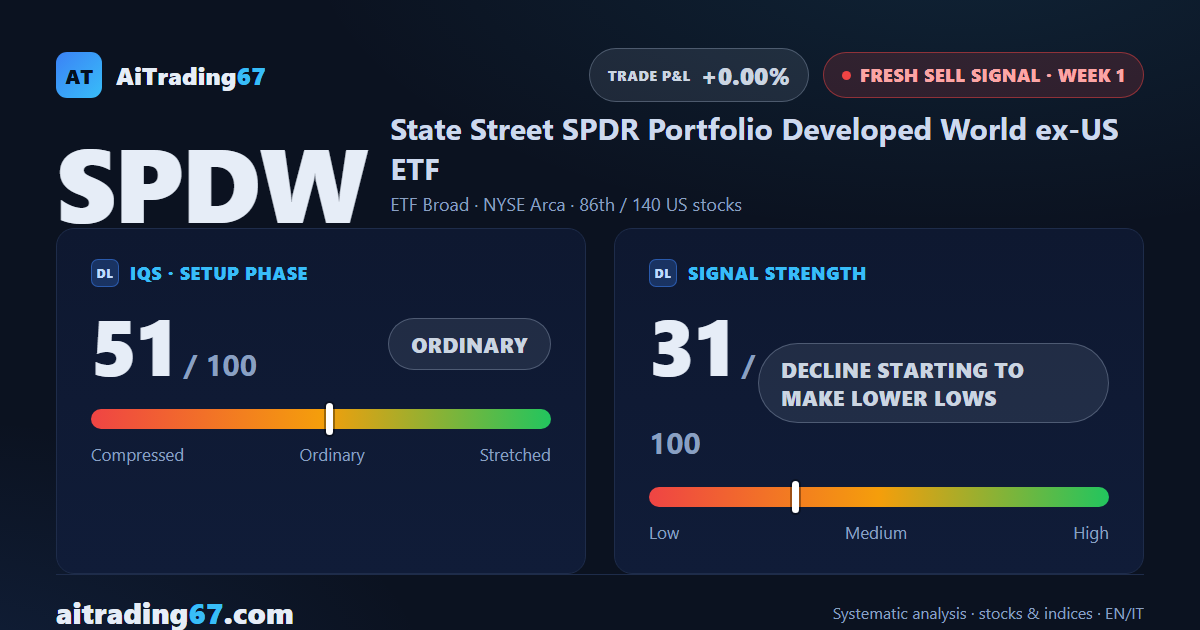
On SPDW, the ETF tracking developed markets outside the US, a fresh sell signal opens this week as price gave back 1.8%, staying boxed between support in the 49.3 area and resistance in the 50.1 area — right where a double bottom in late June sparked a 7% rebound. The cracks were already showing last week, MACD turning negative and ADX fading: now they've turned into a decline starting to make lower lows, though signal strength stays low, 31 out of 100.
IQS Phase
51
ordinary
Signal Strength
31
decline starting to make lower lows
Sizing
REDUCED
Ranking
#86 / 140
New us stocks
Trade P&L %
+0.00%
from signal to today
restricted Platinum content