
EN IT

S&P Global climbs 7.8% as capital flow swings back to buyers

S&P Global technical analysis — week 22 of a sell signal, a 7.8% weekly rebound, CMF back positive, MACD histogram climbing. A look at how the trade in management is evolving.

S&P Global climbs 7.8% as capital flow swings back to buyers
S&P Global · sell signal, week 22
S&P Global climbs 7.8% as capital flow swings back to buyers
July 03, 2026
S&P Global · sell signal, week 22
In Summary
Twenty-second week of the sell signal on S&P Global, listed on the New York Stock Exchange: the week just closed with a 7.8% rebound, with all volume concentrated on the buy side. A double bottom is taking shape in the 396 area on the daily chart, with an intermediate 6% bounce. Here is how the technical picture is moving.
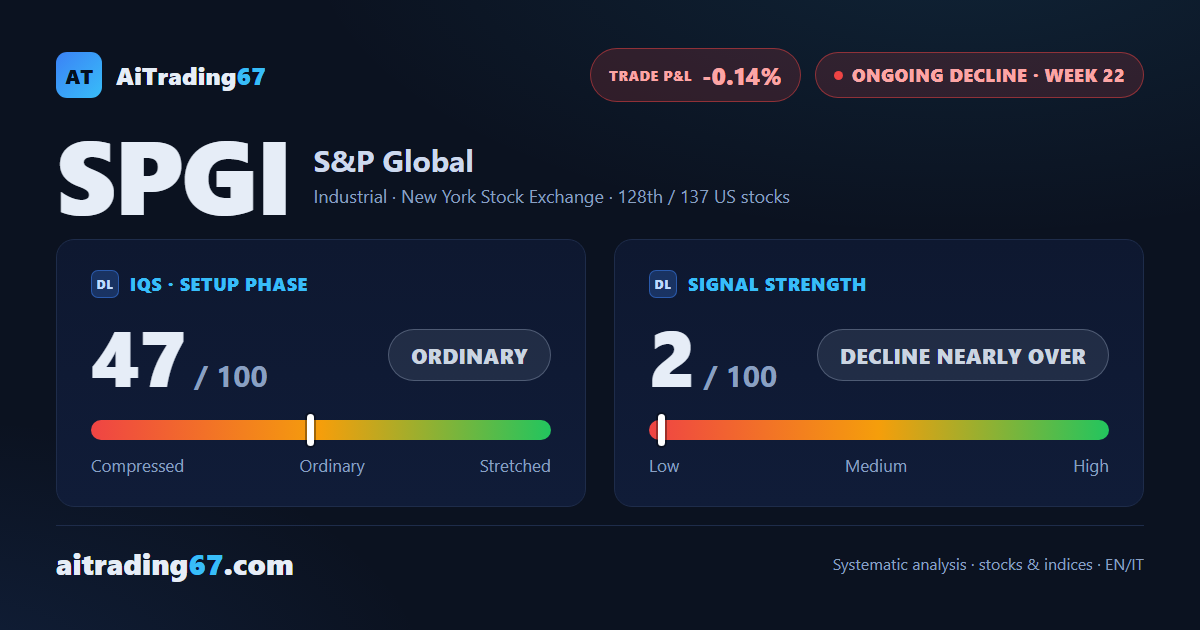
Ongoing decline ·22nd week from start ·US stocks ·T2 ★ See Gold version →
IQS Phase
47
ordinary
Signal Strength
2
decline nearly over
Sizing
MINIMUM
Ranking
#128 / 137
US stocks
Trade P&L %
-0.14%
from signal to today
Chart · Weekly — EMA50 · MACD · VWAP
Weekly chart · EMA50 · MACD · VWAP · Source: TradingView
How to read this pageA visual guide to the post, card by card
The full analysis, operating plan and detailed levels on this asset are reserved for clients ★ PLATINUM
restricted Platinum content
Share WhatsApp Telegram Gmail LinkedIn