
The decline slows as money keeps flowing in
S&P Global slips 2.1% as money flow stays positive and momentum resets
The decline slows as money keeps flowing in
Our view last week
Twenty-second week of the sell signal on S&P Global, listed on the New York Stock Exchange: the week just closed with a 7.8% rebound, with all volume concentrated on the buy side. A double bottom is taking shape in the 396 area on the daily chart, with an intermediate 6% bounce. Here is how the technical picture is moving.
This week's summary
S&P Global's Sell signal gave back 2.1% this week, with sellers back in control of volume at 72%, after last week's 7.8% bounce. Beneath the pullback, money flow stays positive and momentum, stuck below -26 for two weeks, has nearly flattened out. On the daily chart the double bottom in the 396 area still holds, with the weekly RSI still neutral at 47.
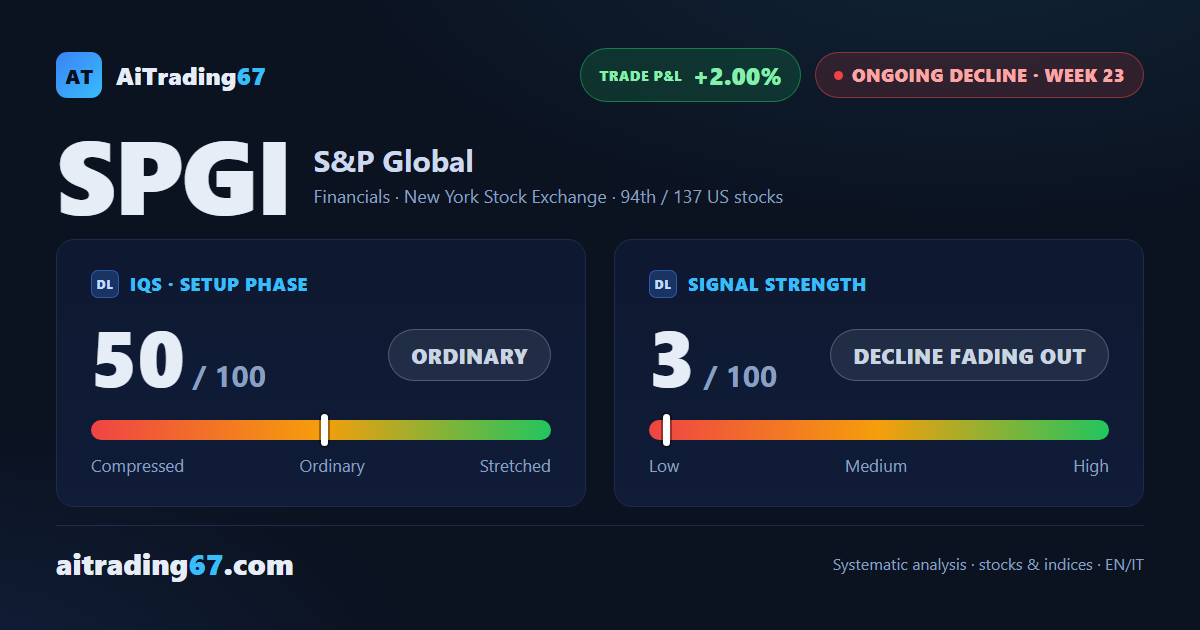
IQS Phase
50
ordinary
Signal Strength
3
decline fading out
Sizing
MINIMUM
Ranking
#94 / 137
US stocks
Trade P&L %
+2.00%
from signal to today
restricted Platinum content