
Spotify: pinned between two key levels this week
Spotify slips 1.3% as the stock gets squeezed between resistance and support
Spotify: pinned between two key levels this week
Our view last week
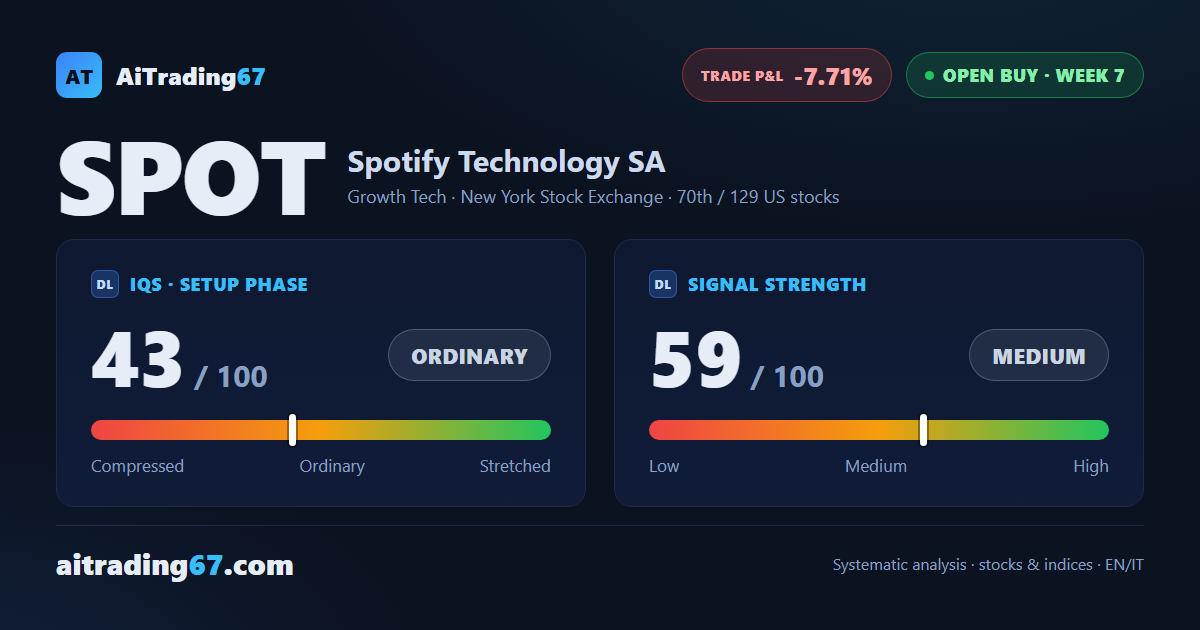
Spotify is in week 6 of a buy signal, but the trade is still slightly negative, and the signal strength at 59 out of 100 points to a wide move rather than firm conviction. The price sits between a nearby resistance and support, and volatility remains elevated: a profile to manage with discipline, not to leave unattended.
This week's summary
Spotify stays pinned between a resistance and a support close by, just as it was last week: the stock slips only 1.3% after the double bottom in the 445 area that sparked an 8% rebound. The weekly ADX is falling, the trend losing conviction, but the weekly MACD keeps improving. The trade, in its 7th week as an open buy signal, is still down 7.7%, with elevated volatility to manage with discipline. Spotify weekly technical analysis worth following closely.
IQS Phase
43
ordinary
Signal Strength
59
medium
Sizing
STANDARD
Ranking
#70 / 129
US stocks in progress
Trade P&L %
-7.71%
from signal to today
restricted Platinum content