
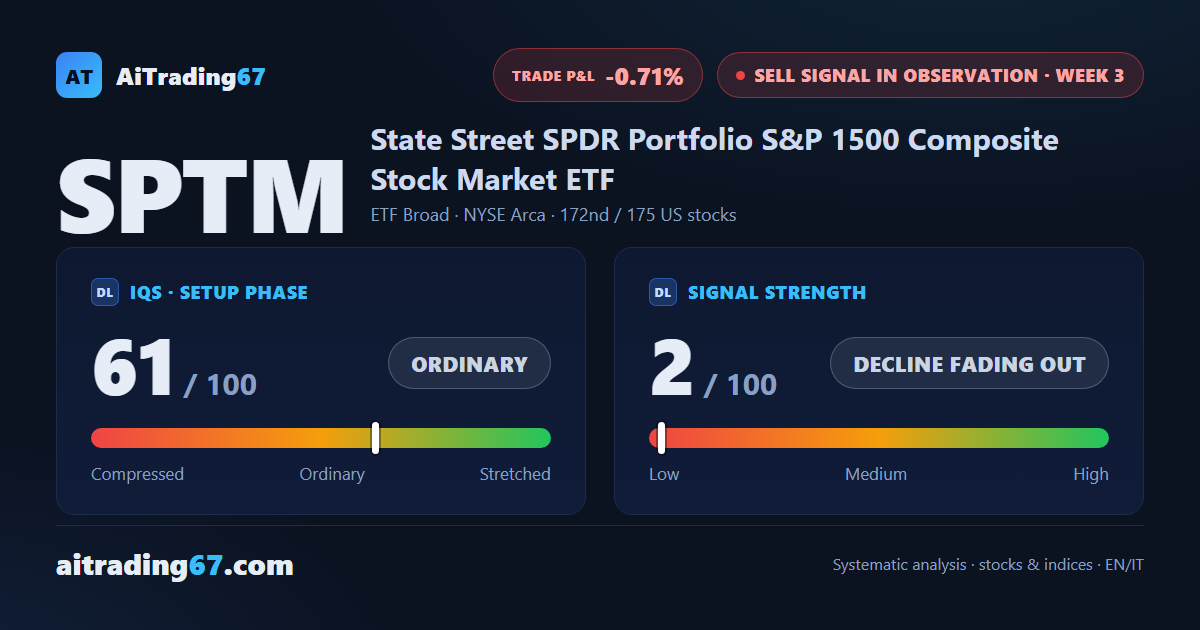
S&P 1500 ETF · Sell signal in observation, week 3
SPTM slips 0.2% and stays a step from its all-time high: the Sell signal has no bite
Our view last week
SPTM, the ETF tracking the S&P 1500 Composite and its broad basket of US stocks, lifts its head: +0.9% on the week, with money flow positive for 19 weeks and buyers taking 85% of daily volume. In price action trading terms, though, the move stalls under the 7-day high in the 93.7 area. SPTM technical analysis reads one of the week's weakest sell signals, strength at 2 out of 100, with the confirmation week still open.
This week's summary
SPTM, the S&P 1500 Composite ETF and its broad basket of US stocks, ends the week almost flat, down 0.2%, and sits 1.7% below its all-time high. Little has changed in 7 days: the ADX has been falling for 5 weeks and the trend is losing conviction, while weekly money flow has stayed positive for 20. SPTM technical analysis reads one of the week's weakest sell signals: a decline fading out, strength at 2 out of 100, with price right under the Inversion Point, in the 94 area.
IQS Phase
61
ordinary
Signal Strength
2
decline fading out
Sizing
MINIMUM
Ranking
#172 / 175
US stocks sell signals
Trade P&L %
-0.71%
from signal to date, no stop loss
SPTM US Total Market weekly chart — EMA50 · MACD · VWAP
Weekly chart · EMA50 · MACD · VWAP · Source: TradingView
Rank position
ranks 172nd among the 175 sell signals for US stocks in our ranking, with a signal strength of 2 out of 100.
Sector context
SectorETF Broad
Benchmark ETF—
Sector regime
Performanceweekly coming soon · monthly coming soon
SPTM belongs to the etf broad sector (reference ETF ).
restricted Platinum content