
The macro backdrop is mixed, not alarming. Expected equity volatility sits in the attention zone, up more than 20% over the past month: a reminder not to lower one's guard. On the bond side, however, stress remains in favorable territory, as does the cost of protection against sharp drops, a sign the market isn't paying up to hedge. The dollar strengthens, also in favorable territory. The bigger concern lies elsewhere: market breadth, the share of stocks above their long-term moving averages, is in the attention zone and falling, while gold, oil and the dry-bulk shipping barometer are all in critical territory, with double-digit declines over the last four weeks. A commodity cooldown that speaks of slowing global demand.
The basket is dominated by technology, which alone weighs nearly 33% of the index. Financials follow at 12.59%, communication services at 10.28%, consumer cyclicals at 9.86% and healthcare at 9.47%. This concentration in tech amplifies both the lift in strong phases and the vulnerability when the macro wind turns.
The weekly snapshot remains solid. The four structural moving averages are all aligned to the upside, price works above the Ichimoku cloud, and RSI at 58 sits in a calm zone of strength, without excess. ADX at 19, though, tells of an orderly trend rather than one in full expansion, and the MACD, while still positive, shows a deteriorating histogram. The distance from the 50-week average, above 7%, confirms a meaningful but not extreme extension. Price has never closed below the 200-week average over the period analyzed.
The daily adds a note of caution. Here RSI drops to 43, price moves inside the Ichimoku cloud and money flows are slightly negative: a short-term pause within an intact underlying trend. On this horizon a double bottom formed in the 720 area, with an intermediate rebound of 6% — a base that held and relaunched prices.
The review of recent weeks is where to linger. The MACD histogram has steadily lost drive, sliding from nearly 6 toward 2.3: the uptrend continues, but the engine runs slower. The structure of the moving averages stays stable and no week has closed below the 200-week average. The historical references to watch are the lows in the 716-722 area, below current prices, and above all the all-time high in the 760 area, a little over 4% away. That ceiling is the immediate constraint: the index is moving back toward recent highs, and here the tension plays out between a fresh advance and a rejection. The confirmation week of the previous signal, it should be noted, closed lower than the one before it.
Bullish weekly reading, structure still positive but with one attention signal.
Double bottom in the 720 area with an intermediate rebound of 6%.
Regime under evaluation: no confirmation candle to observe.
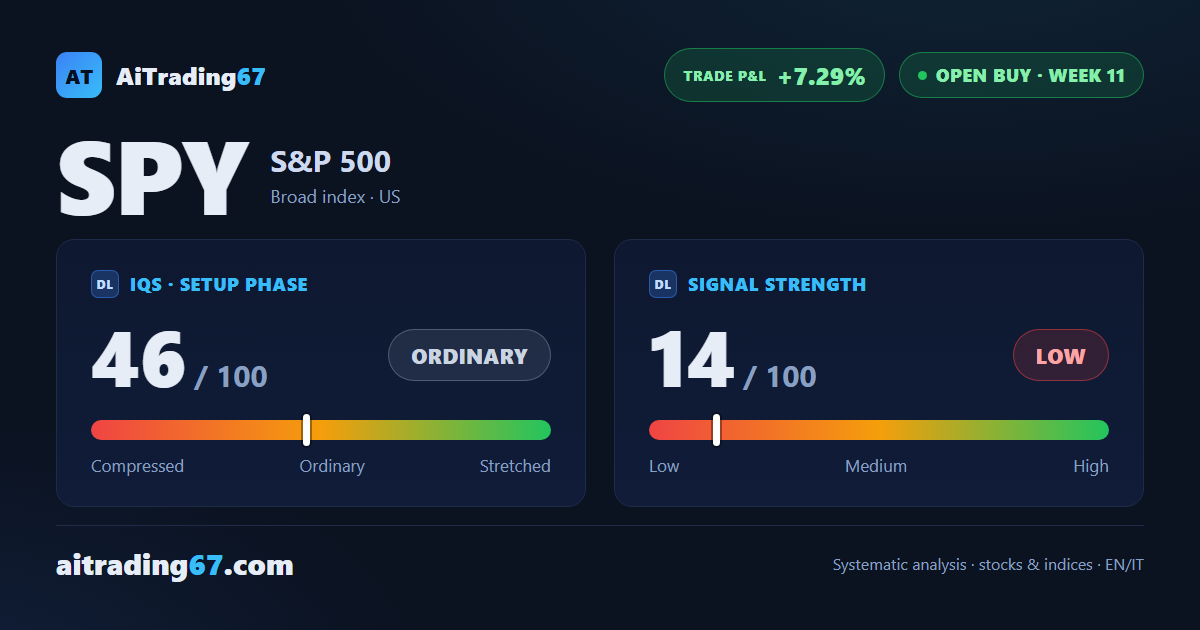
The No-Trade Zone (NTZ), the band where the model advises against new entries, is active in the 727-731 area, just below current prices: price is moving along its upper edge. The primary scenario stays long, consistent with a buy signal running for 11 weeks. The structural stop is anchored to the weekly Inversion Point, the technical level beyond which the read would change; the short side remains available as an alternative scenario, mentioned only for completeness of the levels.
On the management front, two of the three profit-taking areas are already behind us. The scale-out roadmap called for banking a first slice at the 6th week and a second at the 11th, just reached: both windows have passed. The third remains open, expected around the 17th week, while the final residual capital continues its path with a trailing stop on the Inversion Point. These are discretionary management references, not automatic exits.
The point in the cycle reads clearly. Signal Strength recalibrates to 14 out of 100, a low and fading value: the bullish signal is still standing, but momentum has slowed and price now sits right under the all-time high. These are the typical conditions of a mature trade, which our model suggests managing with care — weighing a trim on residual strength rather than adding to the position.
Scale-out roadmap: at the 6th week the model suggested trimming 10% of the position; at the 11th week the model suggested trimming 20% of the position. Remaining: the 17th (30%); the final 40% is residual capital left to run. Discretionary management references, not automatic exits.
LONG
SHORT (alternative scenario)