
The global macro backdrop is mixed but not hostile. The VIX stays in attention zone, with implied volatility down sharply over the past 4 weeks; the MOVE, which gauges tension in the bond market, is in favorable territory, and so is the SKEW: protection against sharp drops in the index is not expensive. Market participation, measured by the share of stocks above their 200-day average, is in attention zone but improving. The dollar remains under observation. Commodities send a more strained signal: gold, oil and the Baltic Dry are all in critical territory, with crude sharply lower.
The basket is led by the technology sector, which alone accounts for almost 33% of the total. Financials follow at 12.6%, communication services at 10.3%, consumer cyclicals at 9.9% and healthcare at 9.5%. It is a broad composition but tilted toward technology: as long as that sector keeps pace, the index's bullish signal stays well supported.
The weekly structure is still full. The four structural moving averages are aligned to the upside, price works above the Ichimoku cloud, and RSI at 62.7 shows strength without reaching extreme territory. The distance from the 50-week average is 9%, a sign of extension that is present but not excessive. Bollinger bands place price in the upper part of the channel, consistent with a trend still tilted higher. Two details, however, call for careful reading: ADX at 17.4 points to a trend that moves but does not accelerate, and the weekly MACD is deteriorating.
On the daily the picture confirms without adding thrust. The moving averages are fully aligned to the upside and price stays above the cloud, but RSI at 53.5 is neutral and the daily money flow is slightly negative, with buying volume below half of the total. Recent price action drew a robust double bottom in the 720 area, with an intermediate rebound of 6%: a credible technical floor defending the ongoing advance.
It is in the review of the recent trend that the key point emerges. The MACD histogram has steadily lost ground — from nearly 5 down to 1.8 over the last four weeks — signaling that the bullish thrust, though intact in direction, is losing intensity. The stack of averages stays stable and price has never closed below the 200-week average over the period examined: structural resilience is not in question. The distance from the all-time high is just 2.1%, with the index hugging the highs and little room to run before the next historical resistance.
Constructive weekly reading but with two attention signals: the structure deserves close monitoring.
Double bottom in the 720 area with an intermediate rebound of 6%.
Regime under evaluation: no confirmation candle to observe.
The No-Trade Zone (NTZ), the price band within which the model advises against new entries, is active in the 741 — 751 area, with price working inside it. The primary scenario remains the open buy: the structural stop is anchored to the weekly Reversal Point, the level below which the bullish signal would break down. On the opposite side the model also keeps the references for a possible short position available, cited only for completeness: the operational picture is and stays long.
On the management side, the indicative profit-taking areas describe a trade already well advanced. The first two trimming windows — the sixth and eleventh weeks — are now behind: our model's discipline suggested banking 10% and 20% of the position respectively. Ahead lies the third window, around the seventeenth week, for a further 30%; the remaining 40% is residual capital, left to run with the trailing stop on the Reversal Point.
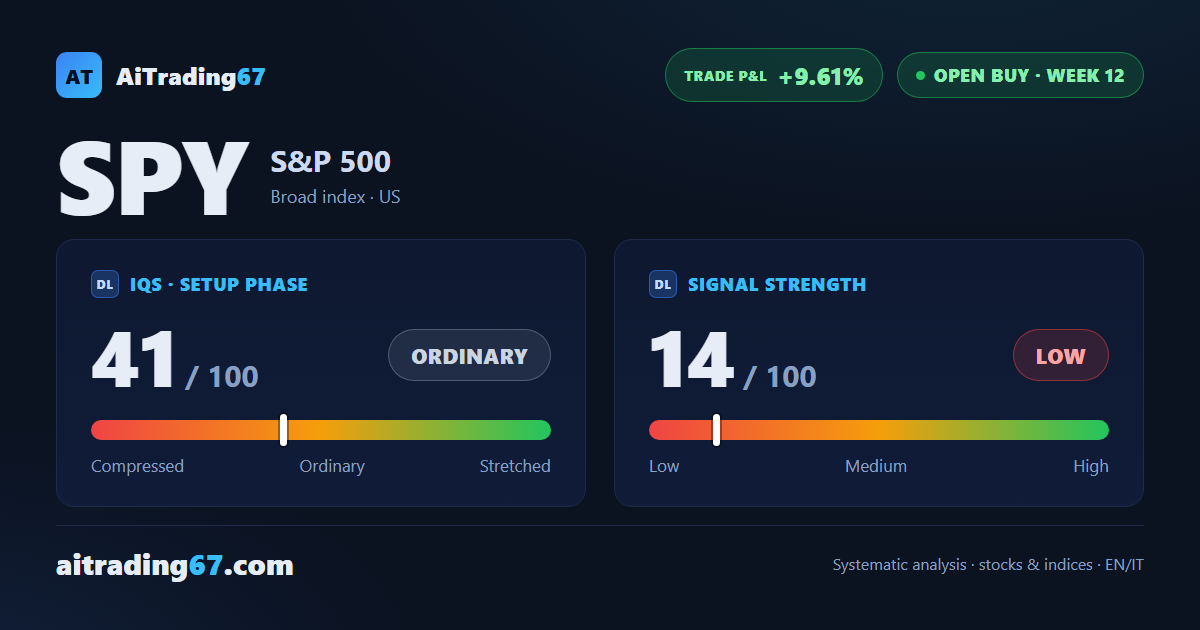
The overall picture is one of a mature uptrend. Signal strength has fallen to 14 out of 100 and the cycle phase, measured by the IQS (Setup Quality Index) at 41, is ordinary: the signal is still active and the structure holds, but the thrust is no longer what it was in the early weeks. With two trimming areas already cleared and momentum cooling, the reading leans toward active management — protecting the accumulated gain and weighing the third window — rather than adding to the position.
Scale-out roadmap: at the 6th week the model suggested trimming 10% of the position; at the 11th week the model suggested trimming 20% of the position. Remaining: the 17th (30%); the final 40% is residual capital left to run. Discretionary management references, not automatic exits.
LONG
SHORT (alternative scenario)