
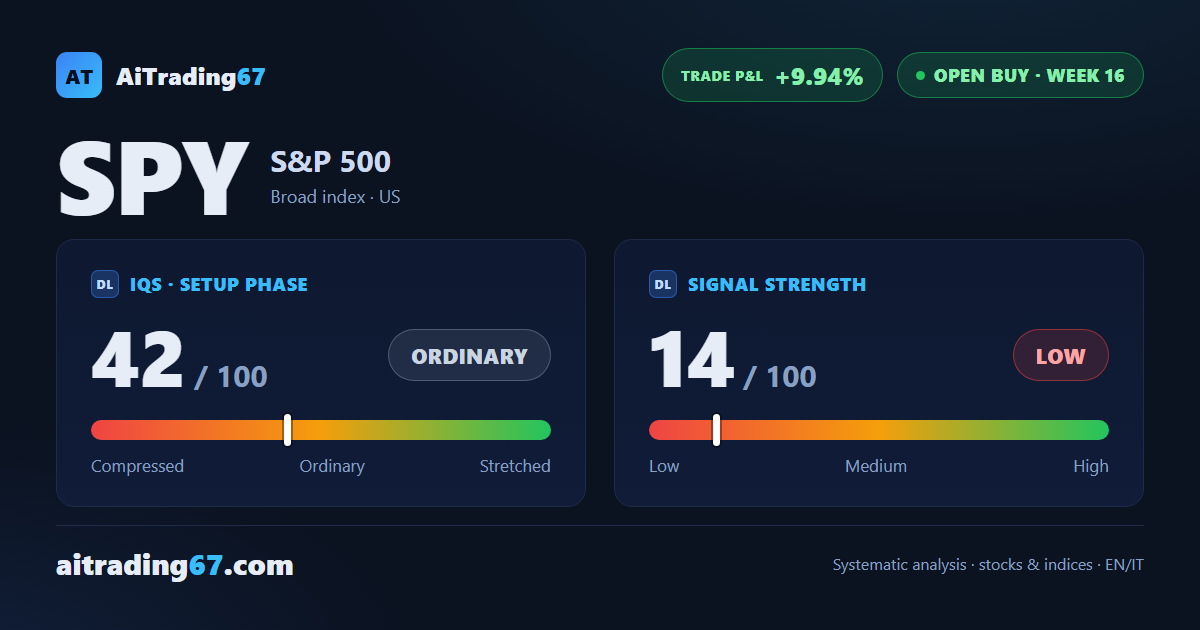
US indices · buy in week 16, up 9.94%
SPY, the S&P 500 ETF: the daily bounces while the weekly drive fades
US indices · buy in week 16, up 9.94%
Our view last week
The SPY, the S&P 500 ETF, tries to reclaim its record but stays under 3% from the highs. Weekly technical analysis frames a buy up 8.75%, down from 9.39% seven days ago. On the daily, buying participation is thin, just above a quarter of turnover, and on the weekly the MACD has just crossed lower. The structure holds, but the drive is fading — an uptrend that has entered its mature phase.
This week's summary
The SPY, the S&P 500 ETF, is pushing back toward its record: the daily has bounced 2% off its 20-day average and buyers account for more than 83% of turnover. Weekly technical analysis tells the other half of the story — the MACD histogram has slipped below zero and ADX is losing conviction. The gain since entry climbs back to 9.94%, with the all-time high less than 2% away. A mature uptrend, inside a rotation that now rewards consumer cyclicals.
IQS Phase
42
ordinary
Signal Strength
14
low · fading
ATH distance
1.79%
1.79%
KPI 4
0/3
Trade P&L %
+9.94%
from signal to date, no stop loss
restricted Platinum content