Snam · Week 5 of sell signal
Snam: decline losing momentum, technical rebound taking shape
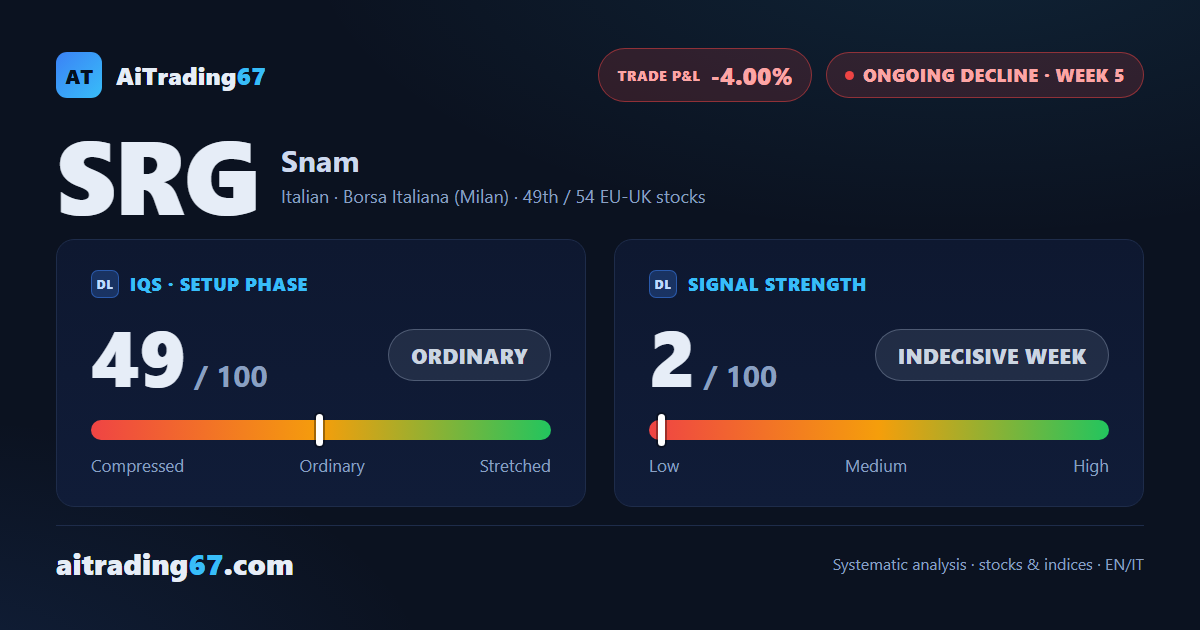
Snam · Week 5 of sell signal
In Summary
Snam is in week 5 of a sell signal the market has yet to confirm. The week just closed nearly flat (+0.2%), but under the surface the technical picture shows growing recovery signals: BuyVol at 99%, CMF climbing toward 0.15, a daily double bottom forming in the 6.2 area. The trade is down 4% from inception.
IQS Phase
49
ordinary
Signal Strength
2
indecisive week
Sizing
MINIMUM
Ranking
#49 / 54
EU-UK stocks
Trade P&L %
-4.00%
from signal to today
restricted Platinum content