
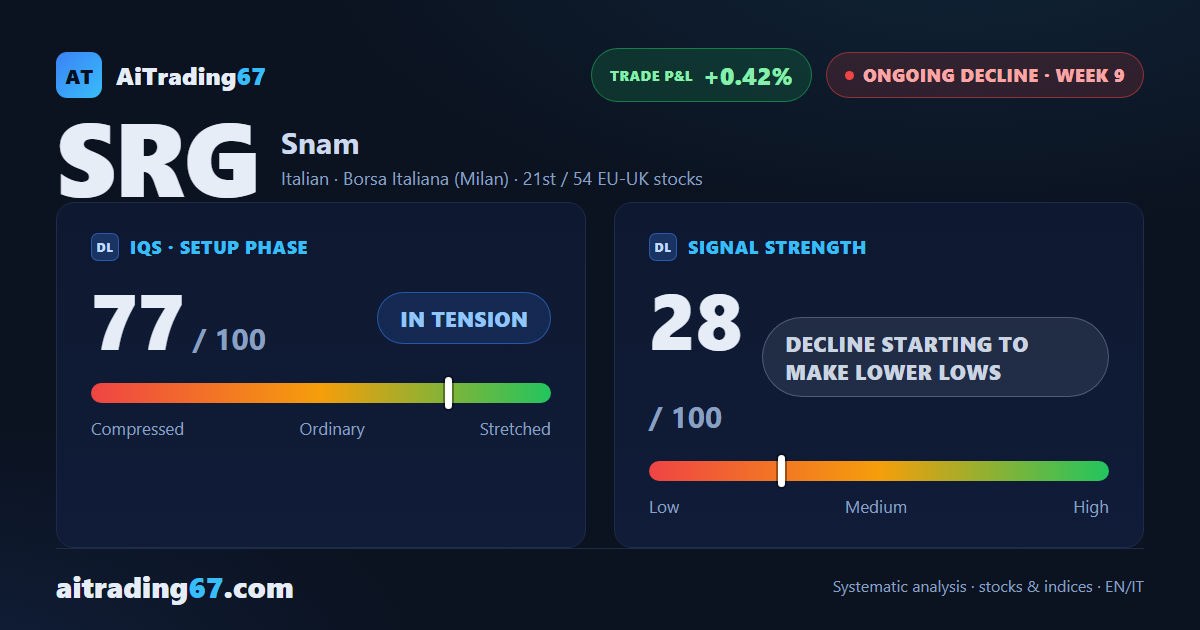
Snam · sell signal, week 9
Snam drops 2.1% this week as sellers retake control of the tape
Snam · sell signal, week 9
Our view last week
Snam is in the eighth week of a sell signal, and the picture from recent sessions describes a decline that holds but no longer accelerates: the daily chart has shown a double bottom in the 6.1 area with a 5% rebound. Selling flow has faded, and next week will tell whether this is a pause or the start of a shift.
This week's summary
Snam shares slip again this week: the decline, which looked to be pausing seven days ago, resumes with a 2.1% drop as sellers retake control of the tape, 93% of volume on the sell side against just 7% on the buy side. Under the surface the picture isn't accelerating: money flow stays positive but has nearly halved in a month, and the weekly ADX keeps fading. The sell signal is in its ninth week, and the trade's gain sits barely above breakeven.
IQS Phase
77
in tension
Signal Strength
28
decline starting to make lower lows
Sizing
MINIMUM
Ranking
#21 / 54
EU-UK stocks
Trade P&L %
+0.42%
from signal to today
restricted Platinum content