
Snam: the decline slows its pace
Snam slips 0.8% as the Sell signal eases after last week's breakdown
Snam: the decline slows its pace
Our view last week
The picture flipped in a week: after the recent rebound attempt, sellers took back 87% of the volume on Snam stock and the shares dropped 5.7%, breaking down out of the tight band between 6.23 and 6.26 where they had been boxed in. The Sell signal, under management for 11 weeks, is moving with the trend again: weekly technical analysis shows RSI sliding under 41 and money flow, still positive, cooling off.
This week's summary
Snam's Sell signal has been under management for 12 weeks, with the short up 5.78%. After last week's 5.7% drop that broke down the tight 6.23-6.26 band, this week's decline slowed to 0.8%: sellers stay in charge but eased to 62% of volume, down from 87%, while money flow stays positive. Weekly technical analysis shows the daily chart still tracing a sequence of lower highs, from the 6.3 area toward 6.0.
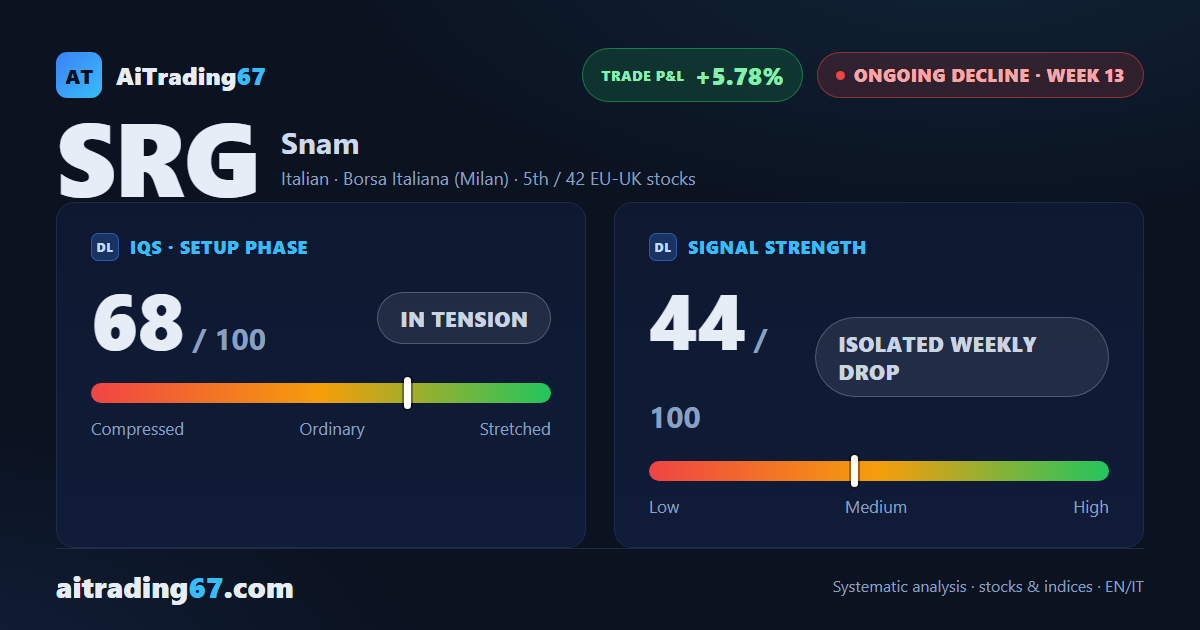
IQS Phase
68
in tension
Signal Strength
44
isolated weekly drop
Sizing
REDUCED
Ranking
#5 / 42
EU-UK stocks
Trade P&L %
+5.78%
from signal to date, no stop loss
Rank position
ranks 5th among the 42 sell signals for European-UK stocks in our ranking, with a signal strength of 44 out of 100.
Sector context
SectorItalian
Benchmark ETFEXH9
Sector regimeweak phase
Performanceweekly +0.59% · monthly -1.81%
SRG belongs to the italian sector (reference ETF EXH9). The sector is classified weak phase according to our weekly reading.
restricted Platinum content