
The bounce that hides a widening divergence
Stellantis claws back the 5.3% it lost last week, but money flow keeps worsening
The bounce that hides a widening divergence
Our view last week
The bounce in Stellantis shares lasted just one week: the stock gave back 5.3% and sellers took charge again, with the weekly ADX still climbing, the trend gaining conviction. Underneath, though, money flow has eased and a clean double bottom has formed on the daily chart in the 5.4 area, with an 11% rebound. The short is over 22% in the money, and in our technical analysis price is boxed between the 5.51 and 5.25 areas.
This week's summary
Stellantis shares bounce 5.3%, clawing back exactly what they gave up the week before, while the daily double bottom in the 5.4 area keeps holding with an 11% rebound. Underneath, though, money flow keeps deteriorating: volume has balanced out between buyers and sellers, but price is climbing as cash keeps leaving, a divergence that in our technical analysis outweighs the bounce itself.
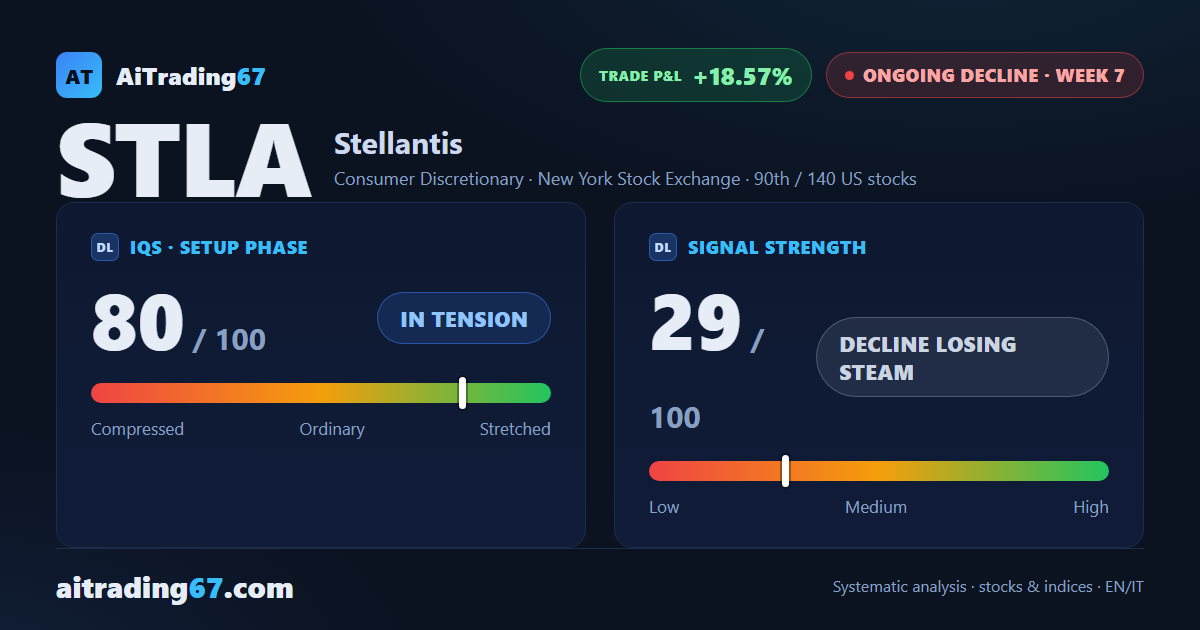
IQS Phase
80
in tension
Signal Strength
29
decline losing steam
Sizing
MINIMUM
Ranking
#90 / 140
US stocks
Trade P&L %
+18.57%
from signal to today
restricted Platinum content