
The decline eases, buyers start showing up
Stellantis sheds 2.0% this week as buy-side volume keeps climbing
The decline eases, buyers start showing up
Our view last week
Stellantis is in the fourth week of a sell signal, and the week just closed down 1.8%. The setup quality indicator stays high at 82 out of 100, and the stock ranks third among the 54 sell signals for European-UK stocks. Signal strength sits at 50 out of 100: an isolated drop, not yet a sign of an accelerating decline.
This week's summary
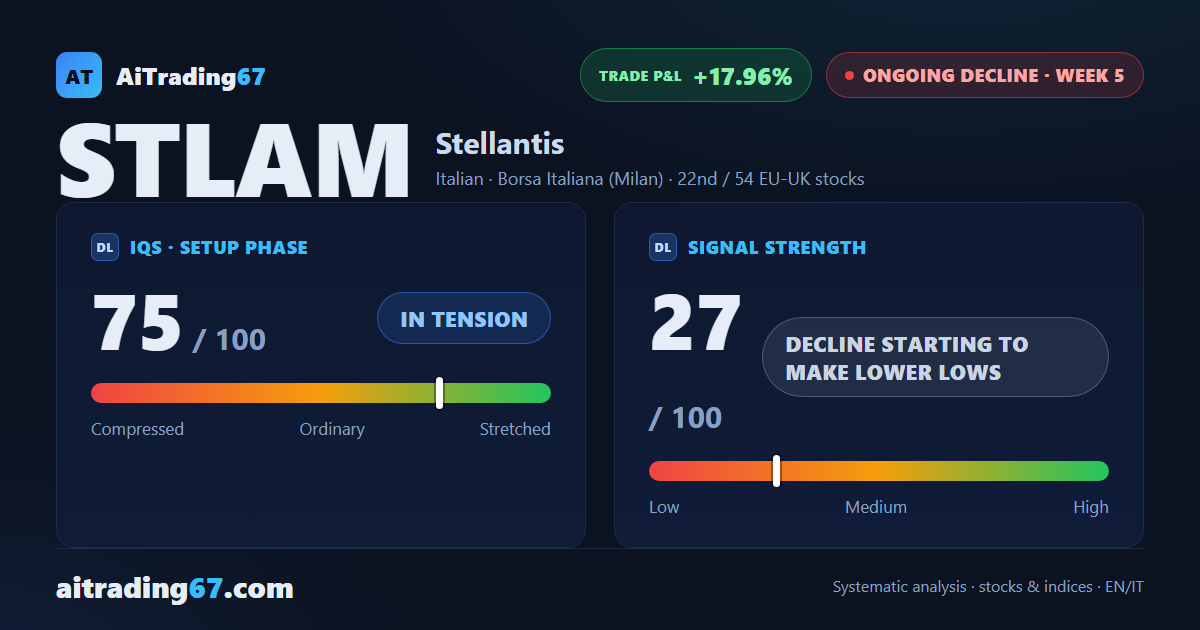
Stellantis shares are easing off the pace of their decline: after a 9.9% plunge two weeks ago, this week's drop slowed to 2.0%, and the daily chart shows a fresh double bottom in the 4.8 area with an 11% rebound. Sellers are still in control — the weekly MACD keeps worsening — but buy-side volume keeps climbing week after week. The Sell signal has been under management since week 5, with the short already up more than 18%.
IQS Phase
75
in tension
Signal Strength
27
decline starting to make lower lows
Sizing
MINIMUM
Ranking
#22 / 54
EU-UK stocks
Trade P&L %
+17.96%
from signal to today
restricted Platinum content