
Stellantis: 8.6% bounce puts the sell signal to the test
Stellantis rebounds 8.6% off a double bottom, sell signal still in play
Stellantis: 8.6% bounce puts the sell signal to the test
Our view last week
Stellantis shares are easing off the pace of their decline: after a 9.9% plunge two weeks ago, this week's drop slowed to 2.0%, and the daily chart shows a fresh double bottom in the 4.8 area with an 11% rebound. Sellers are still in control — the weekly MACD keeps worsening — but buy-side volume keeps climbing week after week. The Sell signal has been under management since week 5, with the short already up more than 18%.
This week's summary
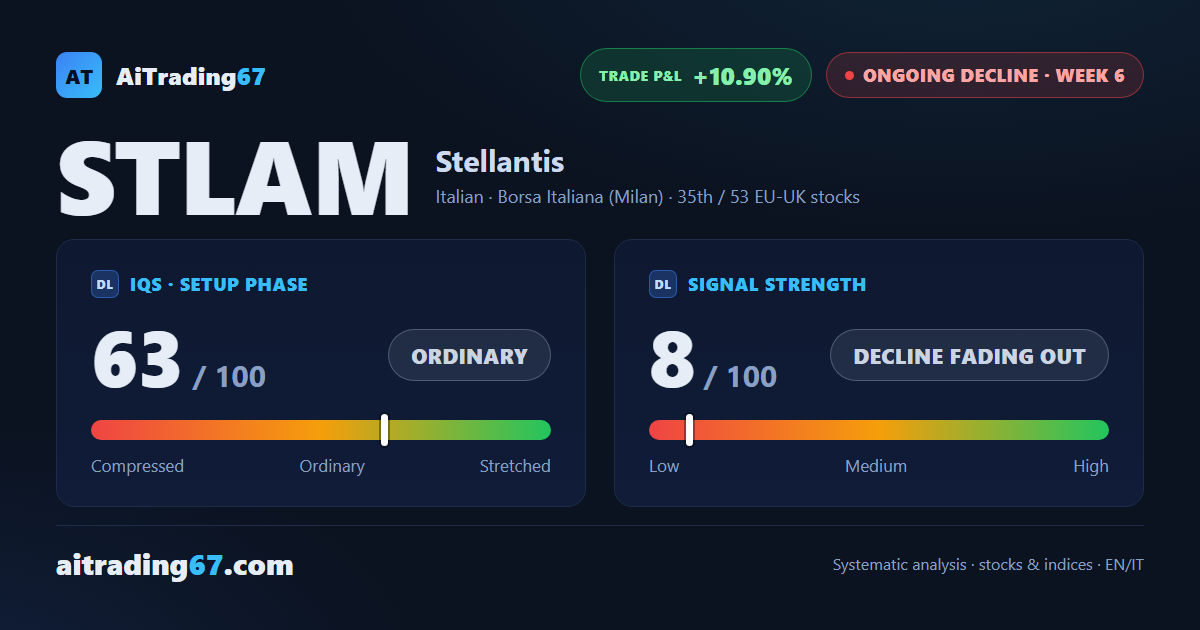
Stellantis stock rebounds 8.6% off a clean double bottom in the 4.8 area — the sharpest bounce since the sell signal began — and this time volume backs it up, with the week almost entirely on the buy side. Our technical analysis flags a price now boxed between the 7-day high and the daily pivot average: the short stays under management, up more than 10%, and earnings in two weeks call for caution on timing.
IQS Phase
63
ordinary
Signal Strength
8
decline fading out
Sizing
MINIMUM
Ranking
#35 / 53
EU-UK stocks
Trade P&L %
+10.90%
from signal to today
restricted Platinum content