
New buy signal · Borsa Italiana (Milan)
STMicroelectronics jumps 11.6% and reclaims its averages in the 47 area: buy signal fires
Our view last week
STMicroelectronics rebounds 3.9%, yet 64% of the week's volume goes to sellers and the price stalls under the moving-average cluster in the 47 area, which pushed it back once more. A week ago it was the mirror image: 91% buying and a falling price. Our technical analysis of STMicroelectronics stock, one of Europe's tech stocks, reads a decline that is slowing, with the MACD histogram and money flow rising for 4 weeks, and a short up 16.1% since entry.
This week's summary
STMicroelectronics jumps 11.6% and reclaims the band of moving averages in the 47 area, where it had stalled 7 days ago. Back then our model read a slowing decline; now STMicroelectronics stock joins this week's new buy signals. On our technical analysis, price action shows an 8% rebound off the 50-day average and money flow turns positive after 10 weeks, while the ADX has been falling for 12: a wide, volatile move for one of Europe's tech stocks, best approached with a cautious entry.
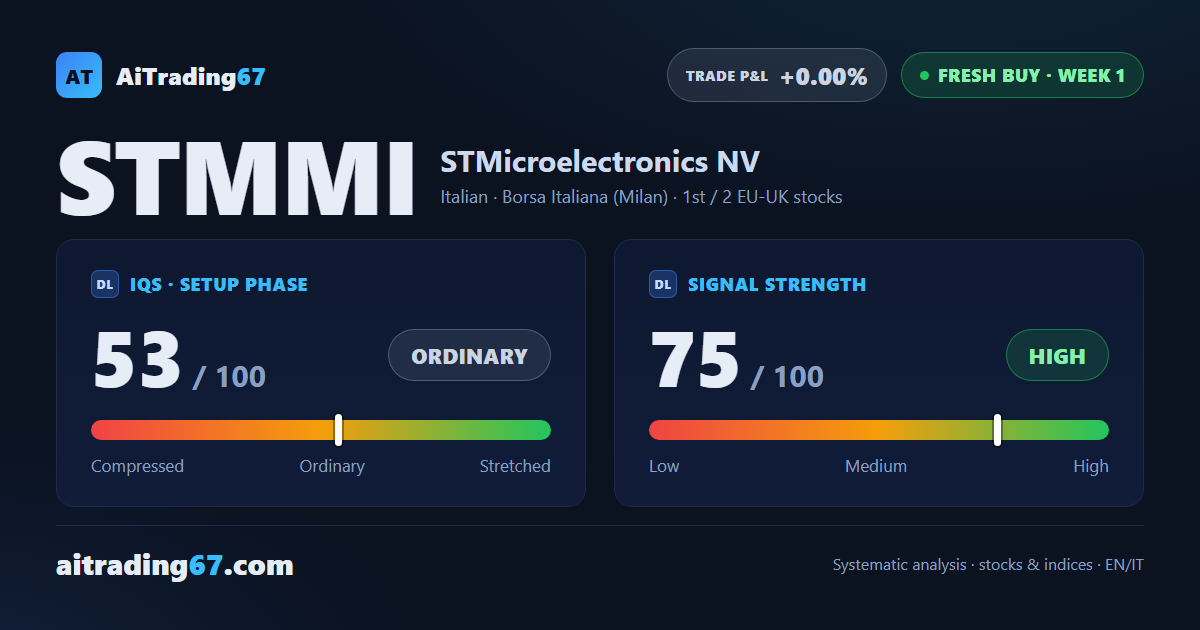
IQS Phase
53
ordinary
Signal Strength
75
high · wide & volatile
Sizing
FULL
Ranking
#1 / 2
New eu-uk stocks
Trade P&L %
+0.00%
from signal to date, no stop loss
STMicroelectronics (STMMI) weekly chart — EMA50 · MACD · VWAP
Weekly chart · EMA50 · MACD · VWAP · Source: TradingView
Rank position
ranks 1st among the 2 fresh Longs for European-UK stocks in our ranking, with a signal strength of 75 out of 100.
Sector context
SectorItalian
Benchmark ETFEXV3
Sector regimein positive regime
Performanceweekly +5.44% · monthly +7.36%
STMMI belongs to the italian sector (reference ETF EXV3). The sector is classified in positive regime according to our weekly reading.
restricted Platinum content