
STMicroelectronics: the decline slows to -2.4%
STMicroelectronics stock sheds 2.4% as its sell signal cools its pace
STMicroelectronics: the decline slows to -2.4%
Our view last week
STMicroelectronics stock drops another 13% in the second week of its Sell signal, and the confirmation closes deep in the red. Our technical analysis shows sellers dominated the last bar to an extreme, money flow stays in distribution, and signal strength hits its ceiling, 100 out of 100: a downtrend making lower lows with no sign of exhaustion. Our model flags trading as not recommended.
This week's summary
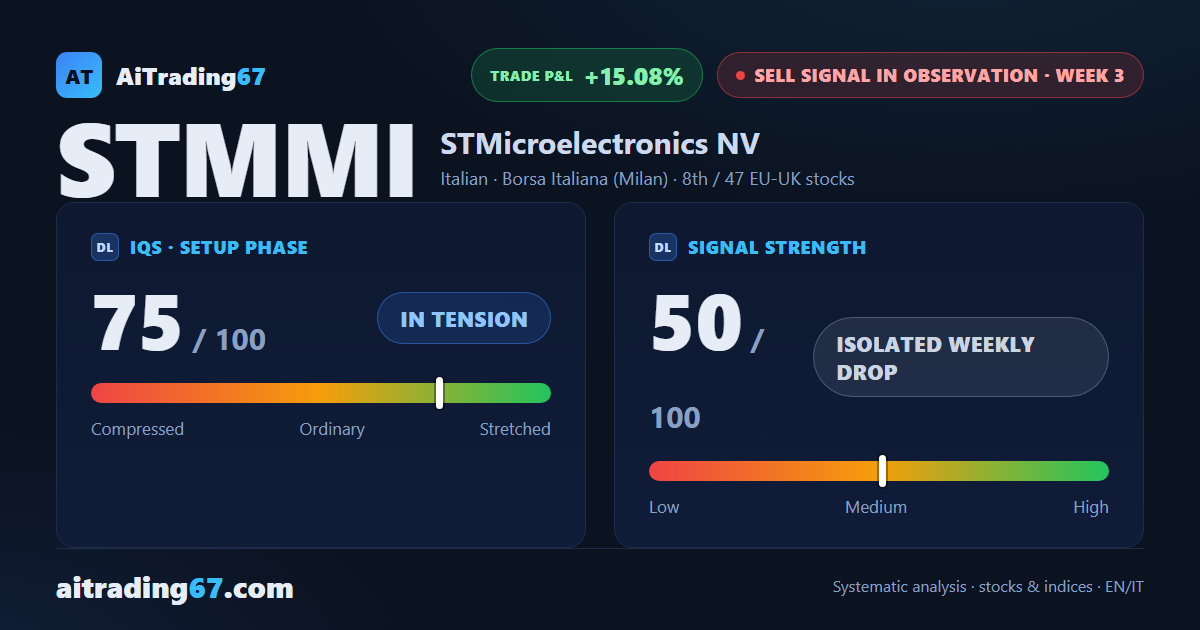
STMicroelectronics's slide eases: after last week's 13% plunge, this week's decline is a more contained 2.4%, and money flow stays in distribution. Signal strength for the sell drops to 50 out of 100, the read of an isolated episode within the ongoing decline. STMicroelectronics stock still ranks 8th among 47 European sell signals, with our technical analysis flagging new entries as high risk.
IQS Phase
75
in tension
Signal Strength
50
isolated weekly drop
Sizing
STANDARD
Ranking
#8 / 47
EU-UK stocks sell signals
Trade P&L %
+15.08%
from signal to date, no stop loss
Rank position
ranks 8th among the 47 sell signals for European-UK stocks in our ranking, with a signal strength of 50 out of 100.
Sector context
SectorItalian
Benchmark ETFEXV3
Sector regimeweak phase
Performanceweekly -0.23% · monthly -6.25%
STMMI belongs to the italian sector (reference ETF EXV3). The sector is classified weak phase according to our weekly reading.
restricted Platinum content