
Momentum stalls in week 12
Schneider Electric slips 3.7% as momentum turns negative after a month-long push
Momentum stalls in week 12
Our view last week
Schneider Electric is in week 11 of a buy signal, with all 3 targets of our most advanced model already hit: coverage is complete, but the real gain stays marginal, just 0.52% since entry. The active stop is now dynamic and tighter than the structural level, consistent with a few technical weakness signals that have emerged recently. The stock ranks 30th among the 62 European-UK stock buys currently open.
This week's summary
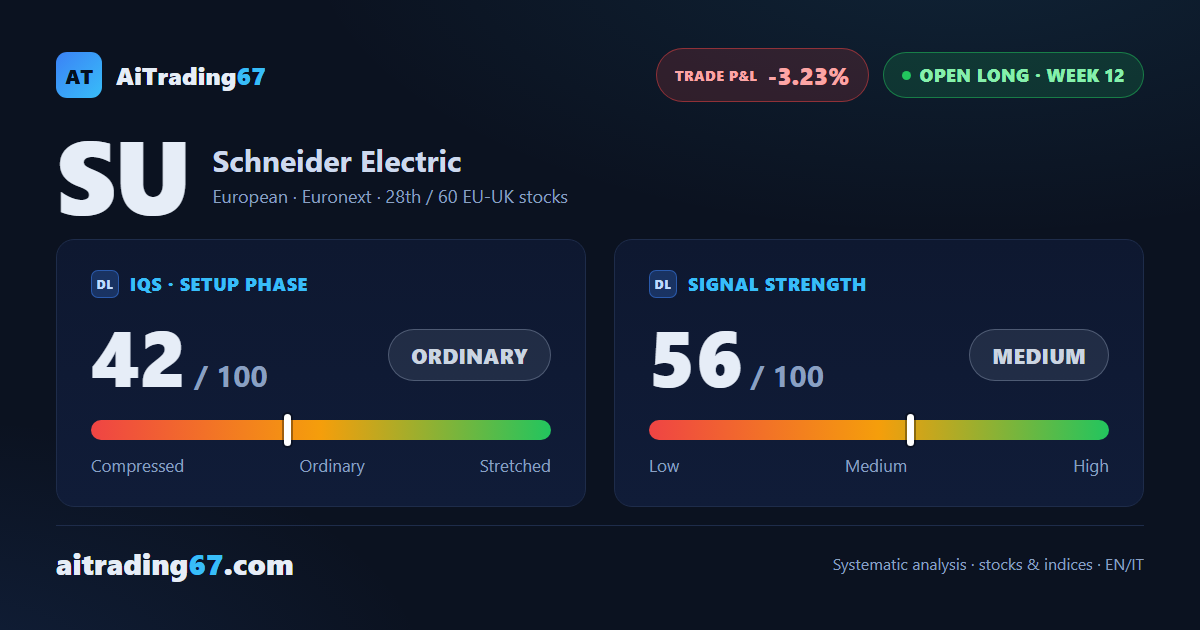
This week's technical analysis on Schneider Electric shows a 3.7% pullback, the third decline in the last four weeks: momentum has turned negative for the first time in a month, and the MACD histogram has all but flattened. Price is boxed between the daily pivot, in the 268.5 area, and the 50-day moving average, in the 272.2 area. Versus last week, when the trade was still showing a small gain, the position has slipped back into the red, down 3.23% from entry.
IQS Phase
42
ordinary
Signal Strength
56
medium
Sizing
STANDARD
Ranking
#28 / 60
EU-UK stocks in progress
Trade P&L %
-3.23%
from signal to today
restricted Platinum content