
Schneider Electric: MACD turns as the trade slips again
Schneider Electric slips 2.7% as the MACD confirms its bearish cross
Schneider Electric: MACD turns as the trade slips again
Our view last week
This week's technical analysis on Schneider Electric shows a 3.7% pullback, the third decline in the last four weeks: momentum has turned negative for the first time in a month, and the MACD histogram has all but flattened. Price is boxed between the daily pivot, in the 268.5 area, and the 50-day moving average, in the 272.2 area. Versus last week, when the trade was still showing a small gain, the position has slipped back into the red, down 3.23% from entry.
This week's summary
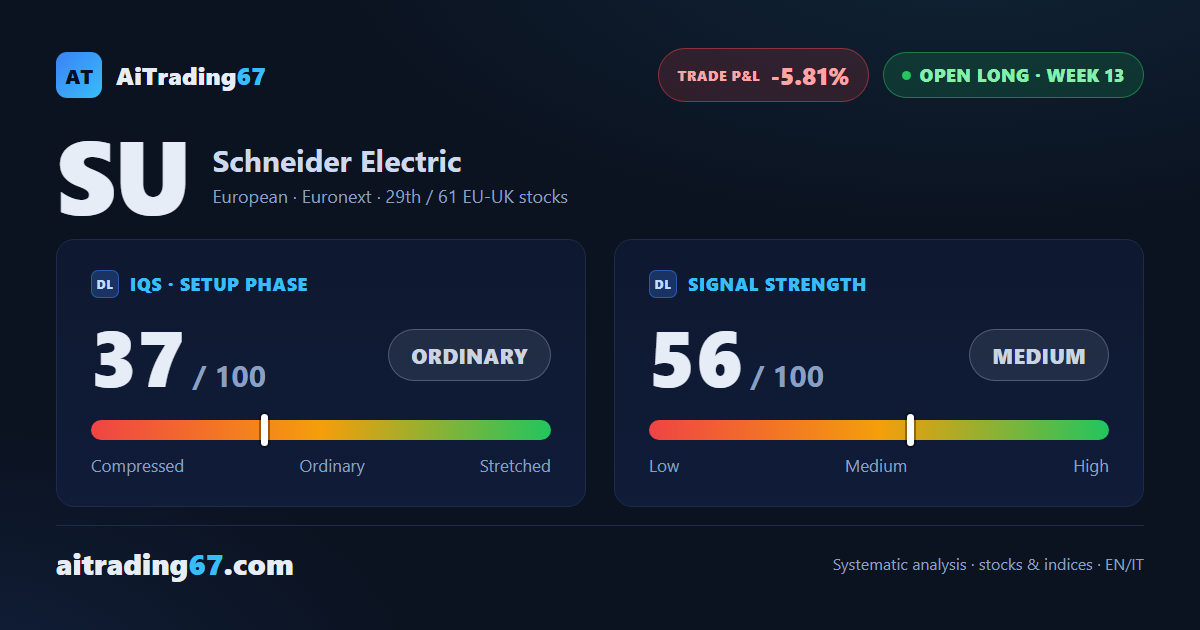
Schneider Electric shares slip another 2.7% this week, the fourth decline in four weeks of technical analysis: the MACD has just confirmed a bearish cross and momentum has turned negative. Money flow has stayed mildly negative for weeks, while price remains boxed between the 20-week average, in the 265 area, and the daily pivot average, in the 261 area. The trade slips to -5.81% from entry.
IQS Phase
37
ordinary
Signal Strength
56
medium
Sizing
STANDARD
Ranking
#29 / 61
EU-UK stocks in progress
Trade P&L %
-5.81%
from signal to today
restricted Platinum content