
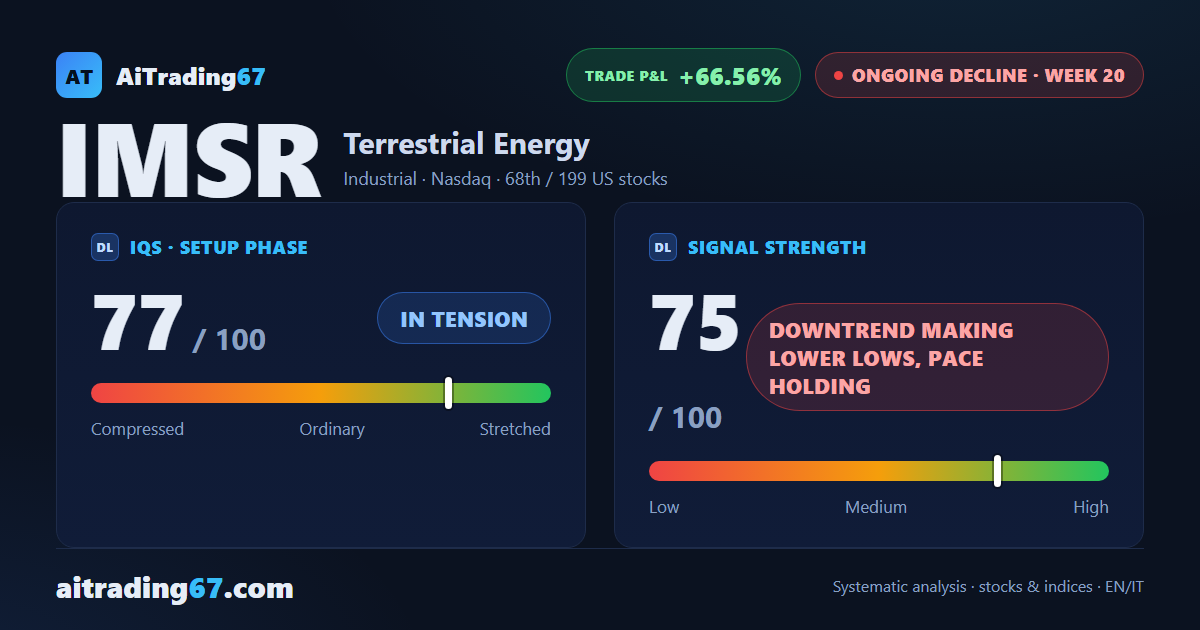
Terrestrial Energy, the decline finds its footing again
Terrestrial Energy -11.8%: a new 30-week low, but the close holds above the old one
Our view last week
Terrestrial Energy stock snapped a 4-week losing run with a 15% gain, in a week that printed a new 30-week low in the 2.7 area the close failed to confirm. The week before, the stock closed near its low; this time it ended mid-range, turned back by the 20-day moving average. The RSI is leaving oversold and money flow stays negative: the price action shows a decline slowing down, the short eases to 50% in profit, and earnings are due on November 10.
This week's summary
Terrestrial Energy stock drops 11.8%, giving back nearly all of the prior week's bounce: it printed a new 30-week low in the 2.44 area and closed above the old one. The price action still points to distribution, the MACD sits below its Signal line, and money flow, still negative, has improved for 2 weeks. Among US stocks on a sell signal, this one is in week 19, with the short more than 56% in profit. For swing trading, earnings land on November 10.
IQS Phase
52
ordinary
Signal Strength
47
decline starting to make lower lows
Sizing
MINIMUM
Ranking
#91 / 181
US stocks
Trade P&L %
+56.04%
from signal to date, no stop loss
Terrestrial Energy (IMSR) weekly chart — EMA50 · MACD · VWAP
Weekly chart · EMA50 · MACD · VWAP · Source: TradingView
Rank position
ranks 91st among the 181 sell signals for US stocks in our ranking, with a signal strength of 47 out of 100.
Sector context
SectorIndustrial
Benchmark ETFXLI
Sector regimeweak phase
Performanceweekly -2.83% · monthly -3.08%
IMSR belongs to the industrial sector (reference ETF XLI). The sector is classified weak phase according to our weekly reading.
restricted Platinum content