
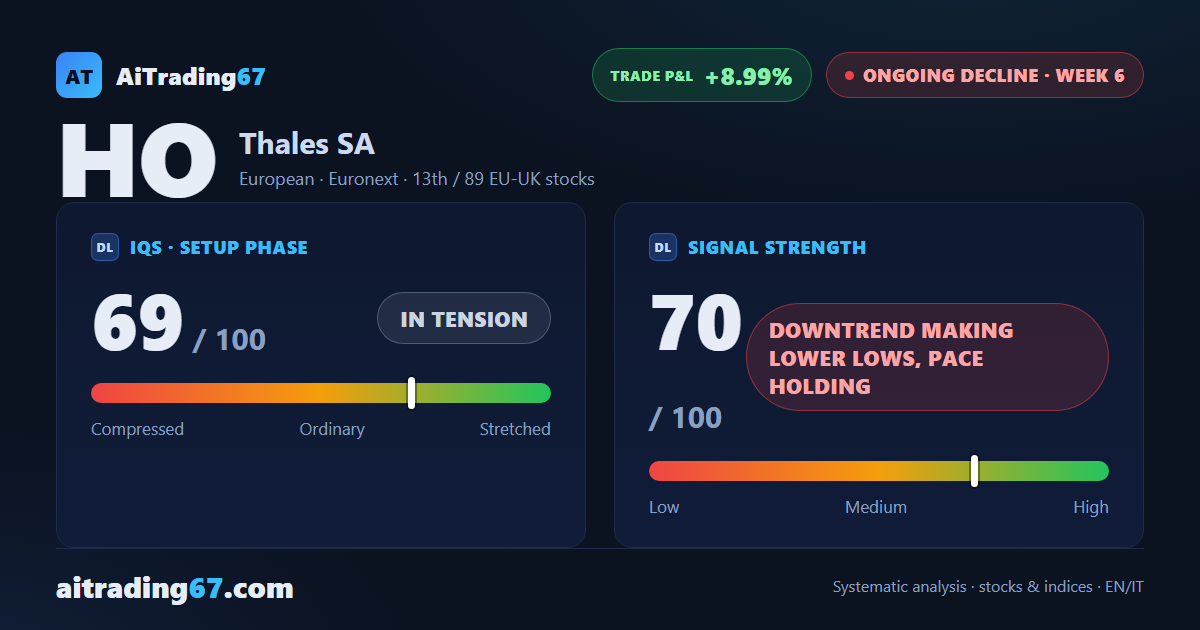
Ongoing decline · week 6 · Euronext
Thales drops 2.9% and slips below its 100-week average as money flow weakens
Our view last week
Last week's 5% rebound didn't hold: turned back by the cluster of moving averages in the 238 area, Thales stock slips 3.7%, and in the weekly price action sellers took 90% of volume. The technical analysis stays bearish, with the MACD digging below its Signal line and money flow negative for 5 weeks. The price is now squeezed between its 7-day low, in the 228.2 area, and the daily Inversion Point average, in the 230.4 area.
This week's summary
Thales drops 2.9%, its 2nd straight weekly decline, and slips a whisker below its 100-week moving average, in the 223 area: the floor in the 228 area that price was leaning on a week ago has given way. Technical analysis of Thales stock stays bearish, with the MACD pulling further under its Signal line and money flow negative for 6 weeks. The price action has yet to show a session able to defend the lows, while a falling ADX points to a trend short on conviction.
IQS Phase
69
in tension
Signal Strength
70
downtrend making lower lows, pace holding
Sizing
STANDARD
Ranking
#13 / 89
EU-UK stocks
Trade P&L %
+8.99%
from signal to date, no stop loss
Thales (HO) weekly chart — EMA50 · MACD · VWAP
Weekly chart · EMA50 · MACD · VWAP · Source: TradingView
Rank position
ranks 13th among the 89 sell signals for European-UK stocks in our ranking, with a signal strength of 70 out of 100.
Sector context
SectorEuropean
Benchmark ETFEXH4
Sector regimeweak phase
Performanceweekly -0.03% · monthly +0.15%
HO belongs to the european sector (reference ETF EXH4). The sector is classified weak phase according to our weekly reading.
restricted Platinum content