
Tilray: decline tests a new low, then selling returns
Tilray drops 2.7% testing a fresh low, but money flow keeps improving
Tilray: decline tests a new low, then selling returns
Our view last week
Tilray's rebound off the lows is widening: after last week's double bottom, this week the stock carved out a second one in the 4.3 area, with a 13% intermediate rebound, even as the weekly close stayed down 4.3%. Under the surface the picture is improving: money flow is normalizing and the ADX has dropped below 12. The Sell signal, under management for ten weeks, keeps the short above 20% in profit.
This week's summary
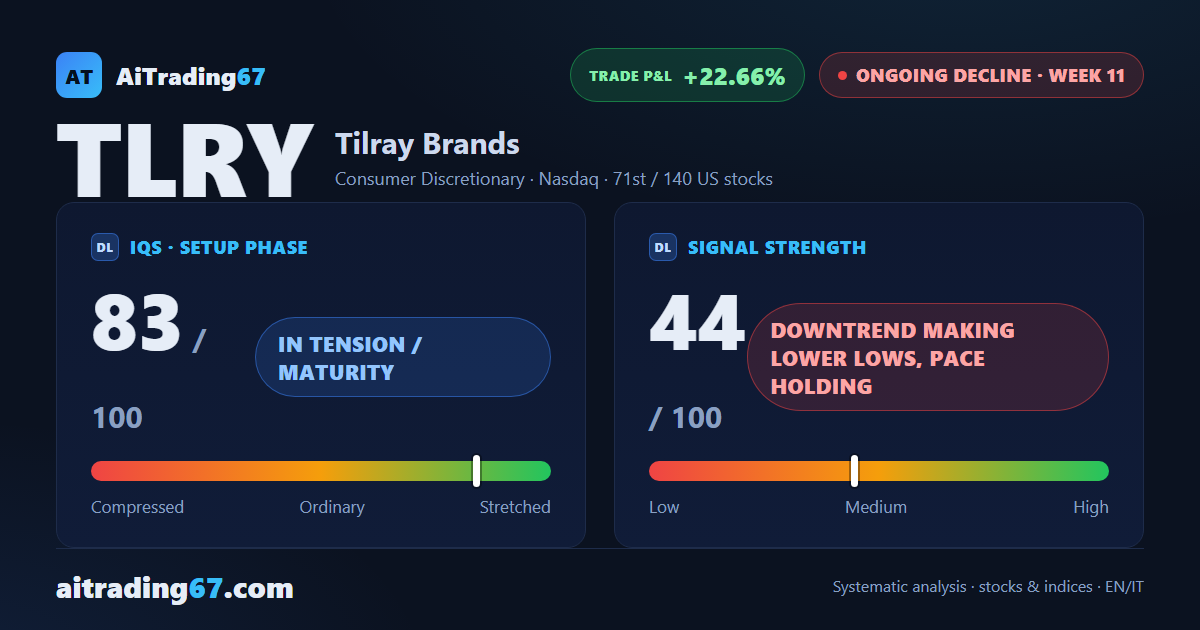
Tilray's bounce hits a wall this week: after a fresh-low attempt in the 4.2 area, with a 9% intermediate rebound, sellers came back in force on the last session, with 84% of volume on the sell side, and the weekly close still finished down 2.7%. Underneath the surface, though, money flow keeps improving. The sell signal stays under management, with the short above 22% in profit, and earnings are now just two weeks away.
IQS Phase
83
in tension / maturity
Signal Strength
44
downtrend making lower lows, pace holding
Sizing
REDUCED
Ranking
#71 / 140
US stocks
Trade P&L %
+22.66%
from signal to today
restricted Platinum content