
Open buy · week 10 · EU-UK stocks
TotalEnergies drops 6.9% on the week and the weekly MACD slips back below Signal
Our view last week
For the second time in September price has reached the highs in the 81 area, and so far no session has turned it away: the move under way continues. TotalEnergies stock closes up 0.8%, a fourth straight positive week, with the weekly MACD above its Signal line and the IQS (setup quality indicator) on the rise. The technical analysis still leaves a knot: contracting volumes and indecisive price action right under a ceiling already tested.
This week's summary
A week ago the highs in the 81 area had yet to turn price away; this week the stock backed off, down 6.9% after 4 straight weekly gains. Technical analysis of TotalEnergies stock shows the weekly MACD back under its Signal line and a price action that points to distribution. Price closed below the first stop level (SL1) flagged in last week's card (75.46 area): for anyone following that level the trade is closed. The close and the Inversion Point, in the 75 area, have already crossed with no change of sign declared: one to watch in the coming sessions.
IQS Phase
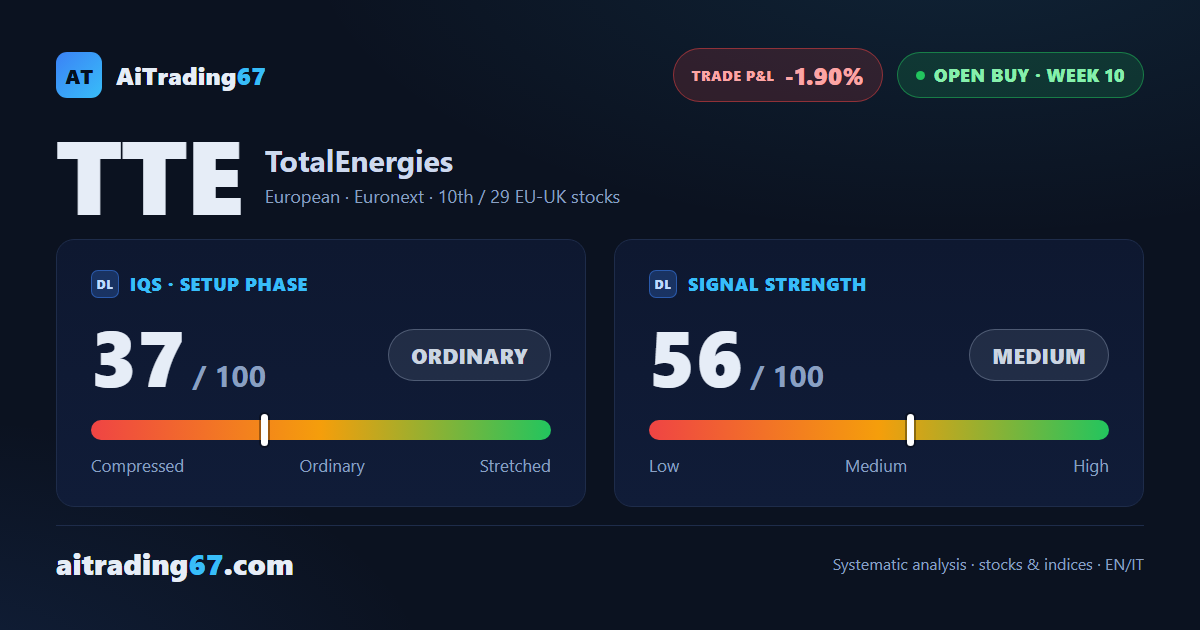
37
ordinary
Signal Strength
56
medium
Sizing
STANDARD
Ranking
#10 / 29
EU-UK stocks in progress
Trade P&L %
-1.90%
from signal to date, no stop loss
TotalEnergies (TTE) weekly chart — EMA50 · MACD · VWAP
Weekly chart · EMA50 · MACD · VWAP · Source: TradingView
Rank position
ranks 10th among the 29 Longs already running for European-UK stocks in our ranking, with a signal strength of 56 out of 100.
Sector context
SectorEuropean
Benchmark ETFEXH1
Sector regimein positive regime
Performanceweekly -1.00% · monthly +1.11%
TTE belongs to the european sector (reference ETF EXH1). The sector is classified in positive regime according to our weekly reading.
restricted Platinum content