
US stocks · New sell signal, week 1
Toyota drops 4.6% and loses its 200-week average as a new Sell signal fires
Our view last week
After last week's drop, Toyota slows down: it gives up just 0.6% and buyers regain the upper hand in the weekly bar, though on contracting volume. The cluster of averages in the 194 area pushed price back again this week, and Toyota stock stays penned between the 50-day moving average, in the 190.4 area, and the daily Inversion Point average, in the 189.9 area. Among US stocks, this swing trading buy signal is still open, 0.7% up since entry.
This week's summary
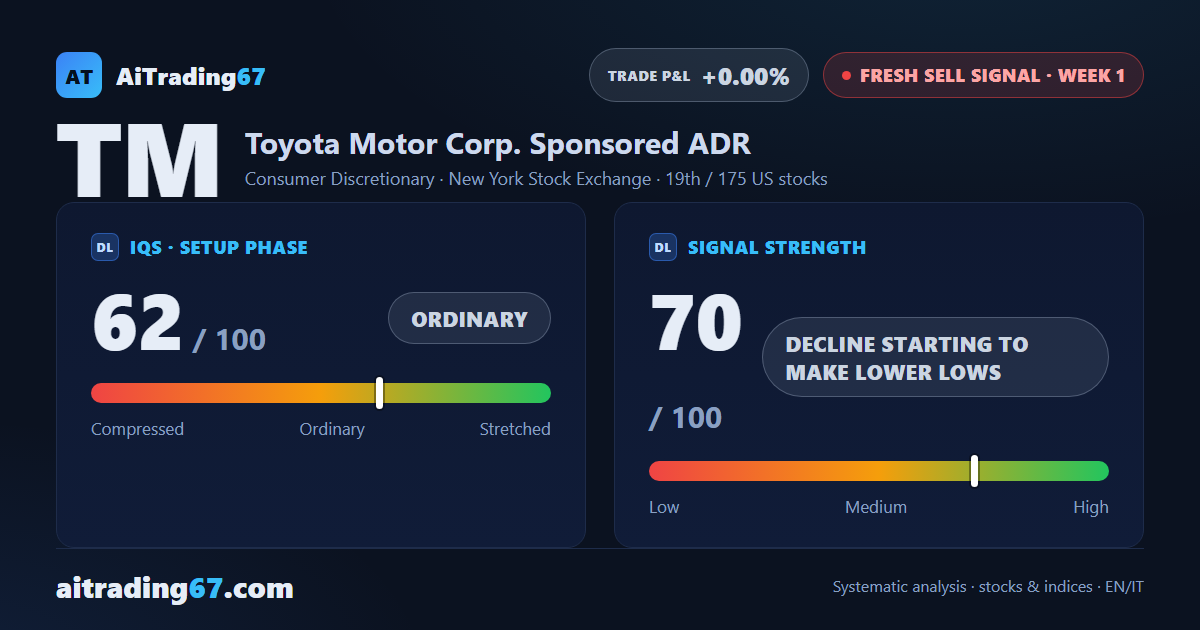
Toyota drops 4.6%, its 3rd straight weekly decline, and closes below the 200-week average, in the 186 area. A week ago the buy signal was still open, with price turned back by its moving averages: now a new Sell signal has fired. Toyota stock is falling on contracting volume, though, and with an ADX that has been sliding for 11 weeks, a trend still short on conviction. On the technical analysis, this is a trade setup to verify: the confirmation week is still open.
IQS Phase
62
ordinary
Signal Strength
70
decline starting to make lower lows
Sizing
STANDARD
Ranking
#19 / 175
New us stocks
Trade P&L %
+0.00%
from signal to date, no stop loss
Toyota Motor (TM) weekly chart — EMA50 · MACD · VWAP
Weekly chart · EMA50 · MACD · VWAP · Source: TradingView
Rank position
ranks 19th among the 175 sell signals for US stocks in our ranking, with a signal strength of 70 out of 100.
Sector context
SectorConsumer Discretionary
Benchmark ETFXLY
Sector regimeweak phase
Performanceweekly -0.47% · monthly -4.20%
TM belongs to the consumer discretionary sector (reference ETF XLY). The sector is classified weak phase according to our weekly reading.
restricted Platinum content