
TSM: flat week, tension beneath the surface
Taiwan Semiconductor closes flat (-0.0%) as weekly money flow turns negative
TSM: flat week, tension beneath the surface
Our view last week
Taiwan Semiconductor is in week 11 of a buy signal, with the trade up 17.18% and our model's coverage already completed: all 3 statistical references have been hit. The stop now follows the Inversion Point, in the 411 area, protecting the gain. The weekly structure remains solid, but some short-term signals call for attention, while earnings are two weeks away.
This week's summary
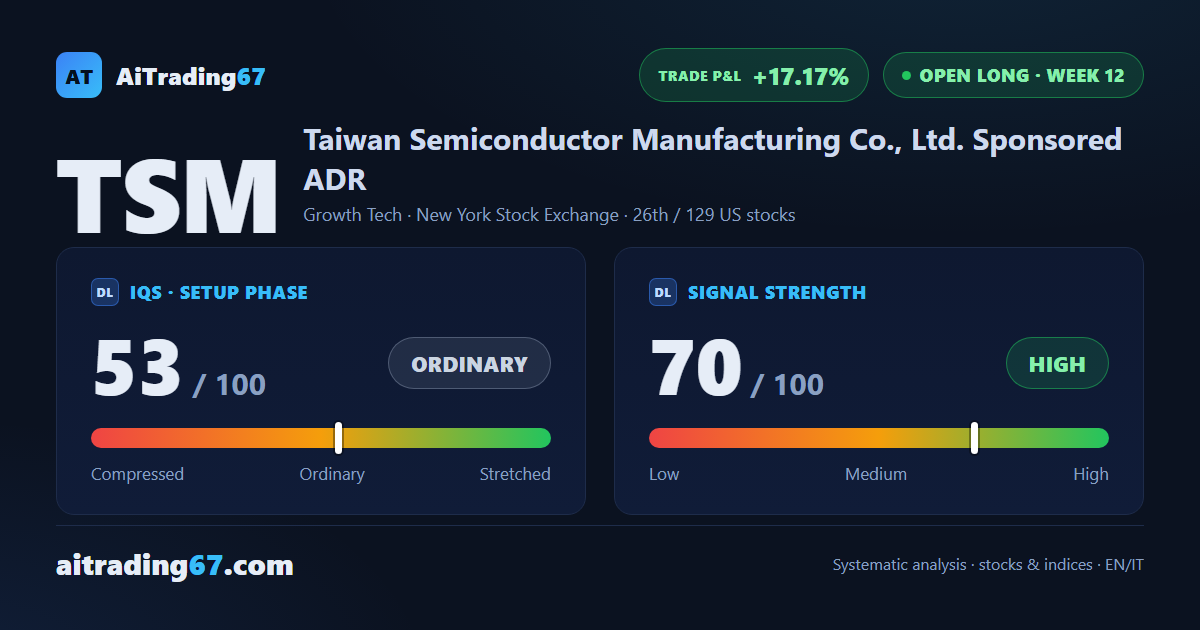
Taiwan Semiconductor's weekly technical analysis shows a nearly flat week (-0.0%) with tension underneath: money flow has turned negative and sellers dominated the last bar, while the daily chart carved a strong double bottom with an 11% rebound. The trade has been under management since week 12, up 17.17%, with earnings due this week.
IQS Phase
53
ordinary
Signal Strength
70
high · wide move
Sizing
FULL
Ranking
#26 / 129
US stocks in progress
Trade P&L %
+17.17%
from signal to today
restricted Platinum content